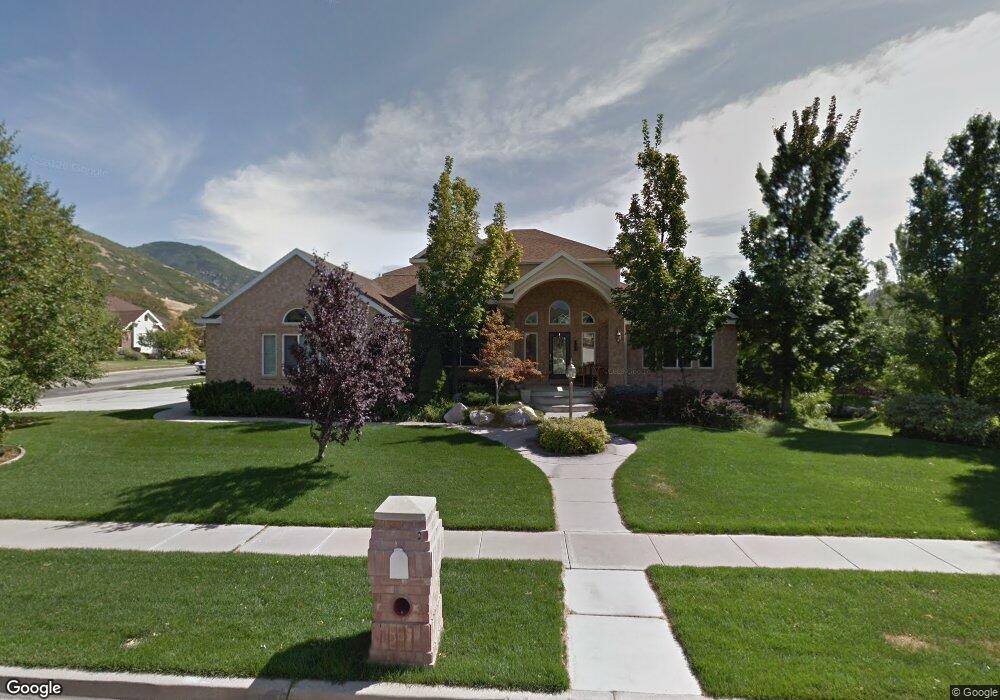
1981 Arapaho Cir Ogden, UT 84403
Southeast Ogden NeighborhoodEstimated Value: $836,000 - $852,000
5
Beds
4
Baths
4,600
Sq Ft
$183/Sq Ft
Est. Value
About This Home
This home is located at 1981 Arapaho Cir, Ogden, UT 84403 and is currently estimated at $843,084, approximately $183 per square foot. 1981 Arapaho Cir is a home located in Weber County with nearby schools including Shadow Valley School, Mount Ogden Junior High School, and Ogden High School.
Ownership History
Date
Name
Owned For
Owner Type
Purchase Details
Closed on
Jun 24, 2011
Sold by
Anjewierden Leslie F
Bought by
Anjewierden Dwight and Anjewierden Leslie F
Current Estimated Value
Home Financials for this Owner
Home Financials are based on the most recent Mortgage that was taken out on this home.
Original Mortgage
$279,878
Outstanding Balance
$18,000
Interest Rate
3.72%
Mortgage Type
New Conventional
Estimated Equity
$825,084
Purchase Details
Closed on
Apr 18, 2008
Sold by
Anjewierden Dwight V and Anjewierden Leslie F
Bought by
Anjewierden Leslie F
Purchase Details
Closed on
Jul 18, 2001
Sold by
Larson Alfred E and Larson Marilyn G
Bought by
Anjewierden Dwight and Anjewierden Leslie F
Home Financials for this Owner
Home Financials are based on the most recent Mortgage that was taken out on this home.
Original Mortgage
$275,000
Interest Rate
7.21%
Purchase Details
Closed on
Nov 21, 1996
Sold by
Larson Marilyn G
Bought by
Larson Alfred E and Larson Marilyn G
Create a Home Valuation Report for This Property
The Home Valuation Report is an in-depth analysis detailing your home's value as well as a comparison with similar homes in the area
Home Values in the Area
Average Home Value in this Area
Purchase History
| Date | Buyer | Sale Price | Title Company |
|---|---|---|---|
| Anjewierden Dwight | -- | Gt Title Kaysville | |
| Anjewierden Leslie F | -- | None Available | |
| Anjewierden Dwight | -- | Associated Title | |
| Larson Alfred E | -- | -- | |
| Larson Alfred E | -- | -- | |
| Larson Alfred E | -- | -- | |
| Larson Alfred E | -- | -- |
Source: Public Records
Mortgage History
| Date | Status | Borrower | Loan Amount |
|---|---|---|---|
| Open | Anjewierden Dwight | $279,878 | |
| Closed | Anjewierden Dwight | $275,000 |
Source: Public Records
Tax History Compared to Growth
Tax History
| Year | Tax Paid | Tax Assessment Tax Assessment Total Assessment is a certain percentage of the fair market value that is determined by local assessors to be the total taxable value of land and additions on the property. | Land | Improvement |
|---|---|---|---|---|
| 2025 | $5,547 | $738,268 | $227,745 | $510,523 |
| 2024 | $5,547 | $420,749 | $125,259 | $295,490 |
| 2023 | $5,577 | $428,450 | $125,260 | $303,190 |
| 2022 | $5,764 | $445,501 | $108,950 | $336,551 |
| 2021 | $4,966 | $635,000 | $124,275 | $510,725 |
| 2020 | $4,682 | $553,000 | $99,383 | $453,617 |
| 2019 | $4,479 | $508,000 | $99,383 | $408,617 |
| 2018 | $4,268 | $472,000 | $99,383 | $372,617 |
| 2017 | $3,991 | $414,000 | $96,430 | $317,570 |
| 2016 | $3,520 | $197,888 | $49,475 | $148,413 |
| 2015 | $3,916 | $216,236 | $49,475 | $166,761 |
| 2014 | $3,659 | $198,952 | $46,599 | $152,353 |
Source: Public Records
Map
Nearby Homes
- 5304 S Skyline Pkwy
- 1880 Shadow Valley Dr
- 1829 Choctaw Ridge
- 1811 Shadow Valley Dr
- 5083 S Ridgedale Dr
- 1710 Mohawk Ln
- 5061 Skyline Pkwy
- 5056 Skyline Pkwy
- 1840 Navajo Dr
- 5028 S Ridgedale Dr
- 2342 E Combe Rd
- 1900 E 5625 S
- 1762 Whispering Oaks Dr
- 5019 Comanche Cir
- 5600 Meadow Ln Unit 193
- 2456 Bonneville Terrace Dr
- 5670 Redwood Ln
- 5660 S Meadow Ln Unit 156
- 1860 Wasatch Dr
- 4895 Knollwood Dr
- 1984 Shoshone Dr
- 183 Arapaho Cir Unit 4386
- 182 Arapaho Dr Unit 182
- 1961 Arapaho Cir
- 1974 Shoshone Dr
- 1976 Arapaho Cir
- 5356 Arapaho Dr
- 5328 Arapaho Dr
- 5328 Arapaho Dr Unit 182
- 1954 Arapaho Cir
- 1960 Shoshone Dr
- 5374 Arapaho Dr
- 1991 Shoshone Dr
- 5307 Arapaho Dr
- 5325 Skyline Dr
- 5302 Arapaho Dr
- 1979 Shoshone Dr
- 1951 Shadow Valley Dr
- 5341 Skyline Dr
- 1946 Shoshone Dr