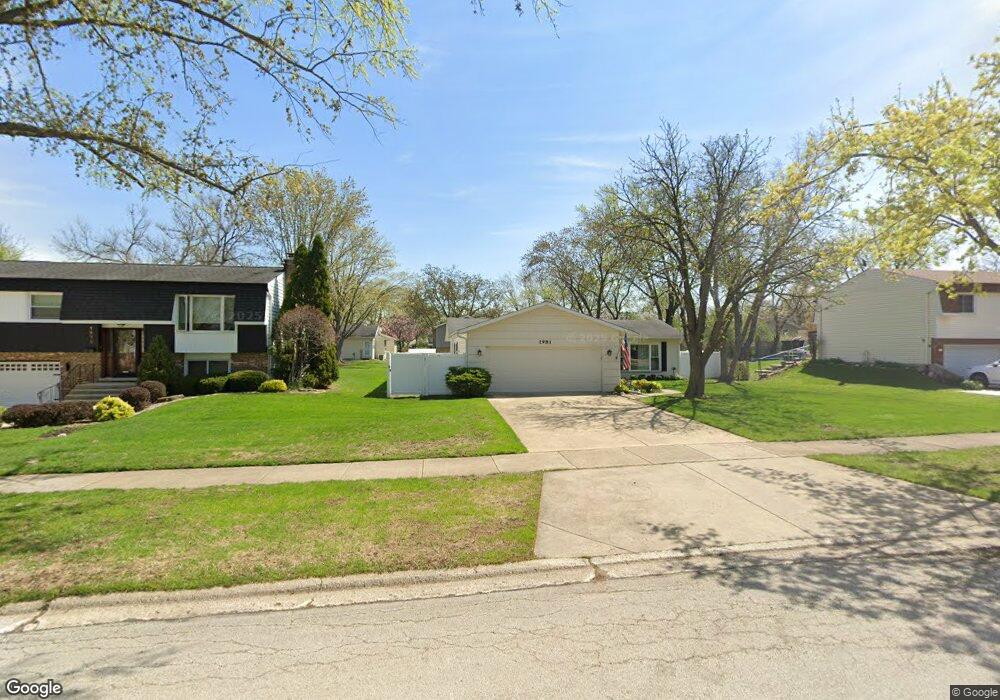
1981 Nottingham Ln Wheaton, IL 60189
North Danada NeighborhoodEstimated Value: $412,260 - $456,000
3
Beds
2
Baths
1,426
Sq Ft
$303/Sq Ft
Est. Value
About This Home
This home is located at 1981 Nottingham Ln, Wheaton, IL 60189 and is currently estimated at $432,065, approximately $302 per square foot. 1981 Nottingham Ln is a home located in DuPage County with nearby schools including Briar Glen Elementary School, Glen Crest Middle School, and Glenbard South High School.
Ownership History
Date
Name
Owned For
Owner Type
Purchase Details
Closed on
Aug 7, 2023
Sold by
Jackson Kenneth T and Jackson Sheila
Bought by
Kenneth T Jackson Sr Trust and Sheila Jackson Trust
Current Estimated Value
Purchase Details
Closed on
Jan 18, 2007
Sold by
Martin John T and Martin Susan L
Bought by
Jackson Kenneth T and Jackson Sheila
Home Financials for this Owner
Home Financials are based on the most recent Mortgage that was taken out on this home.
Original Mortgage
$225,600
Interest Rate
6.27%
Mortgage Type
Purchase Money Mortgage
Purchase Details
Closed on
Mar 13, 1998
Sold by
Corcoran Marie E and Corcoran Trevor Nicholas
Bought by
Martin John T and Martin Susan L
Home Financials for this Owner
Home Financials are based on the most recent Mortgage that was taken out on this home.
Original Mortgage
$156,972
Interest Rate
7.23%
Mortgage Type
VA
Create a Home Valuation Report for This Property
The Home Valuation Report is an in-depth analysis detailing your home's value as well as a comparison with similar homes in the area
Home Values in the Area
Average Home Value in this Area
Purchase History
| Date | Buyer | Sale Price | Title Company |
|---|---|---|---|
| Kenneth T Jackson Sr Trust | -- | None Listed On Document | |
| Jackson Kenneth T | $282,000 | Midwest Title Services Llc | |
| Martin John T | $153,000 | -- |
Source: Public Records
Mortgage History
| Date | Status | Borrower | Loan Amount |
|---|---|---|---|
| Previous Owner | Jackson Kenneth T | $225,600 | |
| Previous Owner | Martin John T | $156,972 |
Source: Public Records
Tax History
| Year | Tax Paid | Tax Assessment Tax Assessment Total Assessment is a certain percentage of the fair market value that is determined by local assessors to be the total taxable value of land and additions on the property. | Land | Improvement |
|---|---|---|---|---|
| 2024 | $5,312 | $115,191 | $36,970 | $78,221 |
| 2023 | $5,538 | $106,030 | $34,030 | $72,000 |
| 2022 | $5,932 | $100,200 | $32,160 | $68,040 |
| 2021 | $6,084 | $97,830 | $31,400 | $66,430 |
| 2020 | $6,204 | $96,920 | $31,110 | $65,810 |
| 2019 | $6,216 | $94,360 | $30,290 | $64,070 |
| 2018 | $6,291 | $86,320 | $28,540 | $57,780 |
| 2017 | $5,835 | $83,140 | $27,490 | $55,650 |
| 2016 | $5,724 | $79,820 | $26,390 | $53,430 |
| 2015 | $5,653 | $76,150 | $25,180 | $50,970 |
| 2014 | $5,603 | $74,570 | $23,680 | $50,890 |
| 2013 | $5,435 | $74,790 | $23,750 | $51,040 |
Source: Public Records
Map
Nearby Homes
- 1265 Windsor Dr
- 1926 Cheshire Ln
- 23W302 Cambridge Ct
- 23W281 Cambridge Ct
- 1756 Plymouth Ct Unit B
- 1755 Plymouth Ct Unit D
- 1733 Harrow Ct Unit B
- 1682 Monticello Ct Unit D
- 1230 Bunker Hill Ct Unit A
- 1135 Mount Vernon Ct Unit B
- 1675 Valley Forge Ct Unit A
- 1120 Mount Vernon Ct Unit C
- 1551 Briarcliffe Blvd
- 121 Brighton Dr
- 1581 Groton Ln
- 371 W Arboretum Cir
- 1026 Briarcliffe Blvd
- 30 Danada Dr
- 270 S Ott Ave
- 453 Raintree Dr Unit 5A
- 1987 Nottingham Ln
- 1975 Nottingham Ln
- 1982 Briarcliffe Blvd
- 1993 Nottingham Ln
- 1976 Briarcliffe Blvd
- 1967 Nottingham Ln
- 1988 Briarcliffe Blvd
- 1978 Nottingham Ln
- 1994 Briarcliffe Blvd
- 1970 Nottingham Ln
- 1970 Briarcliffe Blvd
- 1999 Nottingham Ln
- 1990 Nottingham Ln
- 1966 Nottingham Ln
- 1964 Briarcliffe Blvd Unit I
- 2000 Briarcliffe Blvd Unit 1
- 1996 Nottingham Ln
- 2003 Nottingham Ln
- 1957 Nottingham Ln
- 1962 Nottingham Ln
Your Personal Tour Guide
Ask me questions while you tour the home.