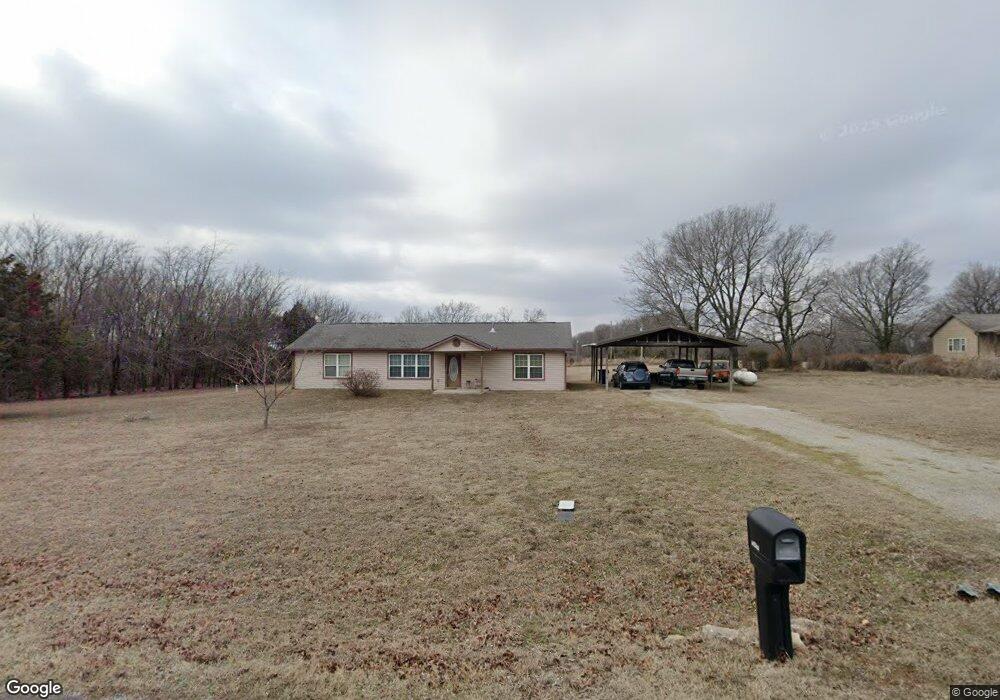
19810 S Covey Ct Claremore, OK 74019
Estimated Value: $206,000 - $314,000
3
Beds
2
Baths
1,456
Sq Ft
$178/Sq Ft
Est. Value
About This Home
This home is located at 19810 S Covey Ct, Claremore, OK 74019 and is currently estimated at $259,804, approximately $178 per square foot. 19810 S Covey Ct is a home located in Rogers County with nearby schools including Stone Canyon Elementary School, Owasso 6th Grade Center, and Owasso 8th Grade Center.
Ownership History
Date
Name
Owned For
Owner Type
Purchase Details
Closed on
Apr 26, 2011
Sold by
Peters George Michael and Peters Leslie
Bought by
Mooney Lisa D
Current Estimated Value
Home Financials for this Owner
Home Financials are based on the most recent Mortgage that was taken out on this home.
Original Mortgage
$101,363
Outstanding Balance
$70,160
Interest Rate
4.87%
Mortgage Type
FHA
Estimated Equity
$189,644
Purchase Details
Closed on
Aug 1, 2007
Sold by
Edems James Horace
Bought by
Peters George Michael and Peters Leslie
Home Financials for this Owner
Home Financials are based on the most recent Mortgage that was taken out on this home.
Original Mortgage
$127,500
Interest Rate
6.73%
Mortgage Type
New Conventional
Purchase Details
Closed on
Jan 5, 2005
Sold by
Ameristar Homes Llc
Bought by
Edkns James Horace and Edens Joyce Elizabeth
Purchase Details
Closed on
Jan 14, 2003
Sold by
Phillips William E
Create a Home Valuation Report for This Property
The Home Valuation Report is an in-depth analysis detailing your home's value as well as a comparison with similar homes in the area
Home Values in the Area
Average Home Value in this Area
Purchase History
| Date | Buyer | Sale Price | Title Company |
|---|---|---|---|
| Mooney Lisa D | $104,000 | Guaranty Abstract Company | |
| Peters George Michael | $125,000 | None Available | |
| Edkns James Horace | -- | None Available | |
| -- | $16,000 | -- |
Source: Public Records
Mortgage History
| Date | Status | Borrower | Loan Amount |
|---|---|---|---|
| Open | Mooney Lisa D | $101,363 | |
| Previous Owner | Peters George Michael | $127,500 |
Source: Public Records
Tax History Compared to Growth
Tax History
| Year | Tax Paid | Tax Assessment Tax Assessment Total Assessment is a certain percentage of the fair market value that is determined by local assessors to be the total taxable value of land and additions on the property. | Land | Improvement |
|---|---|---|---|---|
| 2025 | $1,779 | $16,929 | $3,915 | $13,014 |
| 2024 | $1,779 | $16,123 | $3,728 | $12,395 |
| 2023 | $1,779 | $15,355 | $3,300 | $12,055 |
| 2022 | $1,702 | $15,162 | $3,300 | $11,862 |
| 2021 | $1,603 | $14,440 | $3,300 | $11,140 |
| 2020 | $1,577 | $14,227 | $3,300 | $10,927 |
| 2019 | $1,534 | $13,829 | $3,300 | $10,529 |
| 2018 | $1,520 | $14,165 | $3,300 | $10,865 |
| 2017 | $1,523 | $14,051 | $3,300 | $10,751 |
| 2016 | $1,489 | $13,735 | $3,300 | $10,435 |
| 2015 | $1,482 | $13,475 | $3,300 | $10,175 |
| 2014 | $1,472 | $13,379 | $3,300 | $10,079 |
Source: Public Records
Map
Nearby Homes
- 4728 E Hwy 20
- 11381 N 209th E
- 6025 E Highway 20
- 20225 S 4092 Rd
- 5256 E Hickory Hollow Dr
- 6255 E Canyon View Dr
- 20624 S Brentwood Ave
- 20823 S Concord Ave
- 20603 S Concord Ave
- 6 E Highway 20
- 20612 S Skyline View Rd
- 5163 E Hickory Hollow Dr
- 4608 E 472 Rd
- 4 E Highway 20
- 20903 S Richmond Ave
- 5135 E Hickory Bluff Dr
- 20906 S Windsor Ave
- 5226 E Madison St
- 20775 S Skyline View Rd
- 5132 E Madison St
- 19826 S Covey Ct
- 19826 Covey Ct
- 19822 S Covey Ct
- 19805 S Covey Ct
- 5575 E Covey Ct
- 19782 S Covey Ct
- 19879 S 4084 Rd
- 5595 E Covey Ct
- 19852 S Brittany Dr
- 19704 S Covey Ct
- 4084 S Rd Rd
- 5615 E Covey Ct
- 5655 E Hunter Ln
- 19606 S Covey Ct
- 5624 E Hunter Ln
- 5683 E Hunter Ln
- 5333 E Hwy 20
- 5705 E Hunter Ln
- 5504 E 475 Rd
- 5504 E 475 Rd