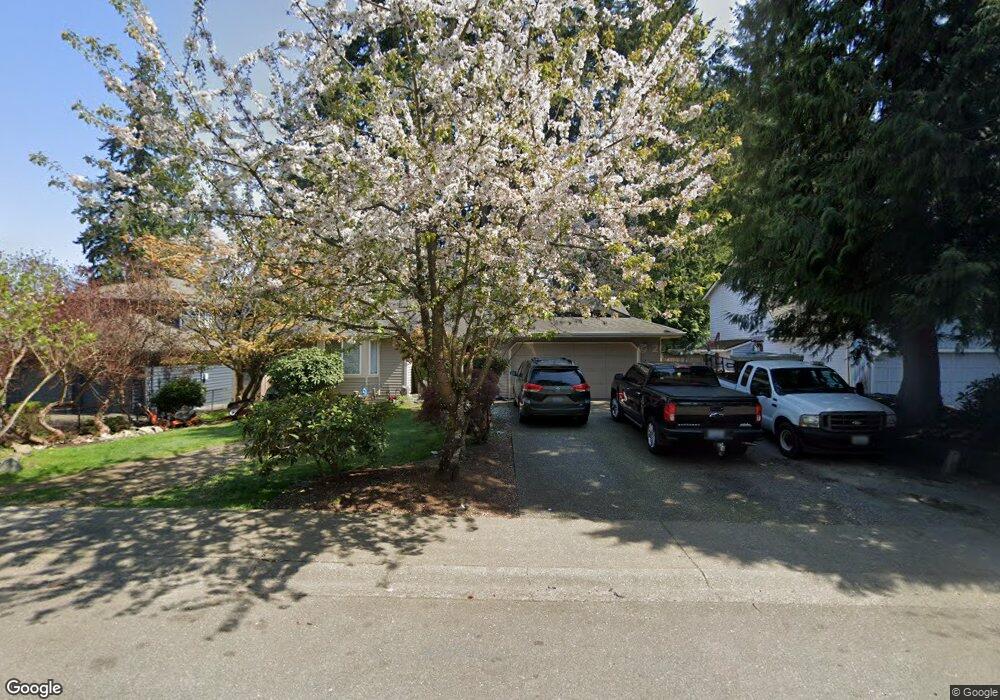
19813 3rd Dr SE Bothell, WA 98012
Queensborough-Brentwood NeighborhoodEstimated Value: $709,000 - $876,000
3
Beds
2
Baths
1,418
Sq Ft
$575/Sq Ft
Est. Value
About This Home
This home is located at 19813 3rd Dr SE, Bothell, WA 98012 and is currently estimated at $814,702, approximately $574 per square foot. 19813 3rd Dr SE is a home located in Snohomish County with nearby schools including Crystal Springs Elementary School, Canyon Park Junior High School, and Bothell High School.
Ownership History
Date
Name
Owned For
Owner Type
Purchase Details
Closed on
May 24, 2004
Sold by
Reloaction
Bought by
Sall Satnam S and Sall Amita D
Current Estimated Value
Home Financials for this Owner
Home Financials are based on the most recent Mortgage that was taken out on this home.
Original Mortgage
$224,950
Outstanding Balance
$109,827
Interest Rate
6.09%
Mortgage Type
Purchase Money Mortgage
Estimated Equity
$704,875
Purchase Details
Closed on
Mar 14, 2000
Sold by
Deusner Miloye E
Bought by
Laulainen Alan B and Laulainen Robin E
Home Financials for this Owner
Home Financials are based on the most recent Mortgage that was taken out on this home.
Original Mortgage
$193,605
Interest Rate
8.21%
Mortgage Type
FHA
Purchase Details
Closed on
Mar 1, 1994
Sold by
Haldeman Michael G and Haldeman Michelle A
Bought by
Deusner Miloye E
Create a Home Valuation Report for This Property
The Home Valuation Report is an in-depth analysis detailing your home's value as well as a comparison with similar homes in the area
Home Values in the Area
Average Home Value in this Area
Purchase History
| Date | Buyer | Sale Price | Title Company |
|---|---|---|---|
| Sall Satnam S | $249,950 | Old Republic Title Ltd | |
| Reloaction | $249,950 | Old Republic Title Ltd | |
| Laulainen Alan B | $194,900 | Chicago Title Insurance Co | |
| Deusner Miloye E | $150,000 | -- |
Source: Public Records
Mortgage History
| Date | Status | Borrower | Loan Amount |
|---|---|---|---|
| Open | Sall Satnam S | $224,950 | |
| Previous Owner | Laulainen Alan B | $193,605 |
Source: Public Records
Tax History
| Year | Tax Paid | Tax Assessment Tax Assessment Total Assessment is a certain percentage of the fair market value that is determined by local assessors to be the total taxable value of land and additions on the property. | Land | Improvement |
|---|---|---|---|---|
| 2025 | $5,905 | $711,500 | $470,000 | $241,500 |
| 2024 | $5,905 | $701,500 | $460,000 | $241,500 |
| 2023 | $6,981 | $906,600 | $630,000 | $276,600 |
| 2022 | $5,850 | $606,500 | $372,000 | $234,500 |
| 2020 | $5,366 | $517,500 | $311,000 | $206,500 |
| 2019 | $4,882 | $482,300 | $255,000 | $227,300 |
| 2018 | $4,593 | $427,800 | $225,000 | $202,800 |
| 2017 | $4,021 | $384,800 | $195,000 | $189,800 |
| 2016 | $3,794 | $351,400 | $173,000 | $178,400 |
Source: Public Records
Map
Nearby Homes
- 19726 Filbert Dr
- 20029 7th Ave SE
- 727 198th Place SE
- 24 199th Place SE
- 429 203rd Place SE
- 105 202nd St SE
- 603 194th Place SE
- 820 Grimes Rd
- 19921 10th Dr SE
- 1126 199th St SE
- 20224 11th Dr SE
- 1216 199th St SE
- 19228 Meridian Dr SE Unit CW 10
- 19221 Meridian Dr SE Unit CW 16
- 525 192nd Place SE
- 20511 Greening Rd
- 130 203rd Place SW
- 309 207th Place SE
- 19112 Meridian Dr SE Unit CW 01
- 110 204th Place SW
- 19610 2rd (Lot 50 Autumn Crest) Dr SE
- 19821 3rd Dr SE
- 19805 3rd Dr SE
- 19906 Filbert Dr
- 19829 3rd Dr SE
- 19908 Filbert Dr
- 19808 3rd Dr SE
- 19816 3rd Dr SE
- 19907 4th Ave SE
- 19917 4th Ave SE
- 19824 3rd Dr SE
- 423 199th Place SE
- 19910 Filbert Dr
- 19803 Filbert Dr
- 19830 3rd Dr SE
- 429 199th Place SE
- 410 199th Place SE
- 19900 Filbert Dr
- 19900 3rd Dr SE
- 19929 4th Ave SE
Your Personal Tour Guide
Ask me questions while you tour the home.