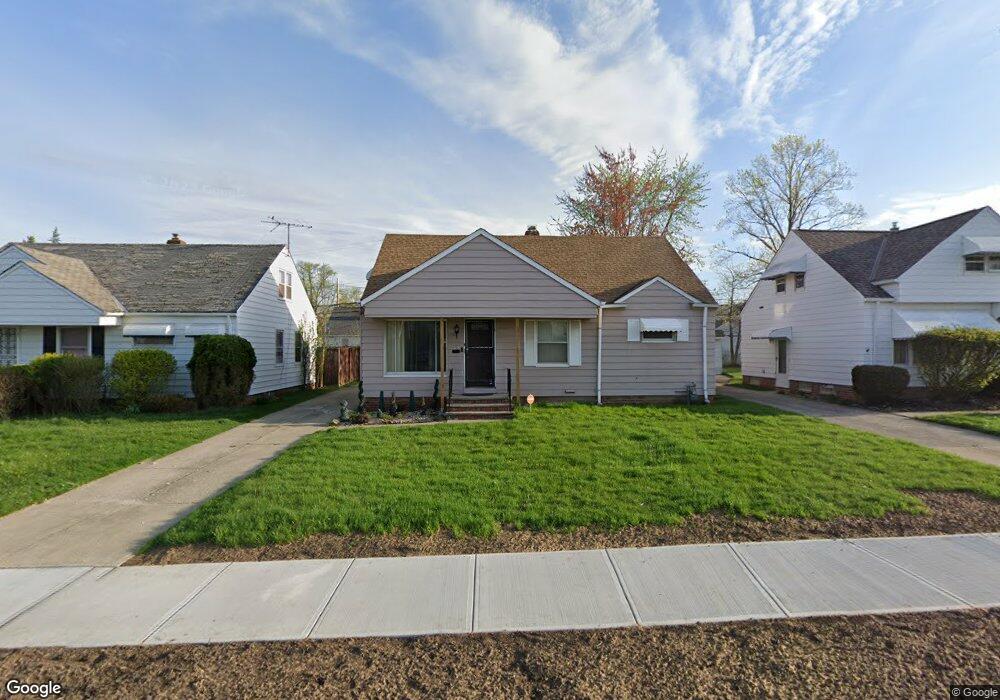
19817 Stockton Ave Maple Heights, OH 44137
Estimated Value: $126,000 - $148,000
3
Beds
1
Bath
1,401
Sq Ft
$95/Sq Ft
Est. Value
About This Home
This home is located at 19817 Stockton Ave, Maple Heights, OH 44137 and is currently estimated at $132,593, approximately $94 per square foot. 19817 Stockton Ave is a home located in Cuyahoga County with nearby schools including Abraham Lincoln Elementary School, Rockside/ J.F. Kennedy School, and Italy High School.
Ownership History
Date
Name
Owned For
Owner Type
Purchase Details
Closed on
Mar 12, 2015
Sold by
Douglas Andrea G
Bought by
Johnson Sonia
Current Estimated Value
Purchase Details
Closed on
Oct 1, 2009
Sold by
Secretary Of Housing & Urban Development
Bought by
Douglas Andrea
Purchase Details
Closed on
Jun 27, 2007
Sold by
Murray Trevin D
Bought by
Hud
Purchase Details
Closed on
Sep 11, 1996
Sold by
Robinson John W
Bought by
Tells Betty J
Home Financials for this Owner
Home Financials are based on the most recent Mortgage that was taken out on this home.
Original Mortgage
$83,950
Interest Rate
8.29%
Mortgage Type
FHA
Purchase Details
Closed on
May 5, 1993
Sold by
Varrati Frank C
Bought by
Robinson John W
Purchase Details
Closed on
Jun 19, 1978
Sold by
Varrati Frank C and Laverne C
Bought by
Varrati Frank C
Purchase Details
Closed on
Jan 1, 1975
Bought by
Varrati Frank C and La Verne C
Create a Home Valuation Report for This Property
The Home Valuation Report is an in-depth analysis detailing your home's value as well as a comparison with similar homes in the area
Home Values in the Area
Average Home Value in this Area
Purchase History
| Date | Buyer | Sale Price | Title Company |
|---|---|---|---|
| Johnson Sonia | -- | None Available | |
| Douglas Andrea | $14,000 | Lakeside Title & Escrow Agen | |
| Hud | $40,000 | Attorney | |
| Tells Betty J | $84,000 | -- | |
| Robinson John W | $75,000 | -- | |
| Varrati Frank C | -- | -- | |
| Varrati Frank C | -- | -- |
Source: Public Records
Mortgage History
| Date | Status | Borrower | Loan Amount |
|---|---|---|---|
| Previous Owner | Tells Betty J | $83,950 |
Source: Public Records
Tax History Compared to Growth
Tax History
| Year | Tax Paid | Tax Assessment Tax Assessment Total Assessment is a certain percentage of the fair market value that is determined by local assessors to be the total taxable value of land and additions on the property. | Land | Improvement |
|---|---|---|---|---|
| 2024 | $3,678 | $41,020 | $7,070 | $33,950 |
| 2023 | $2,277 | $20,790 | $5,040 | $15,750 |
| 2022 | $2,269 | $20,790 | $5,040 | $15,750 |
| 2021 | $2,415 | $20,790 | $5,040 | $15,750 |
| 2020 | $2,072 | $15,750 | $3,820 | $11,940 |
| 2019 | $2,058 | $62,000 | $10,900 | $51,100 |
| 2018 | $2,230 | $21,700 | $3,820 | $17,890 |
| 2017 | $1,725 | $12,430 | $4,970 | $7,460 |
| 2016 | $1,666 | $14,350 | $4,970 | $9,380 |
| 2015 | $10,403 | $14,350 | $4,970 | $9,380 |
| 2014 | $10,403 | $15,790 | $5,460 | $10,330 |
Source: Public Records
Map
Nearby Homes
- 19812 Stockton Ave
- 19289 Stafford Ave
- 19806 Mountville Dr
- 20107 Libby Rd
- 19807 Gardenview Dr
- 19520 Maple Heights Blvd
- 20510 Mountville Dr
- 19221 Stafford Ave
- 20701 Kenyon Dr
- 18909 Maple Heights Blvd
- 5265 Bellview St
- 5165 Camden Rd
- 20625 Centuryway Rd
- 20814 Kenyon Dr
- 5409 Hollywood Ave
- 19309 Nitra Ave
- 5357 Beechwood Ave
- 5571 Oakwood Ave
- 20120 Mccracken Rd
- 20814 Watson Rd
- 19821 Stockton Ave
- 19813 Stockton Ave
- 19809 Stockton4ab
- 19901 Stockton Ave
- 19809 Stockton Ave
- 19901 Stockton 3 4fr
- 19820 Libby Rd
- 19900 Libby Rd
- 19816 Libby Rd
- 19904 Libby Rd
- 19812 Libby Rd
- 19905 Stockton Ave
- 19805 Stockton Ave
- 19908 Libby Rd
- 19820 Stockton Ave
- 19808 Libby Rd
- 19900 Stockton Ave
- 19808 Stockton Ave
- 19912 Libby Rd
- 19804 Libby Rd