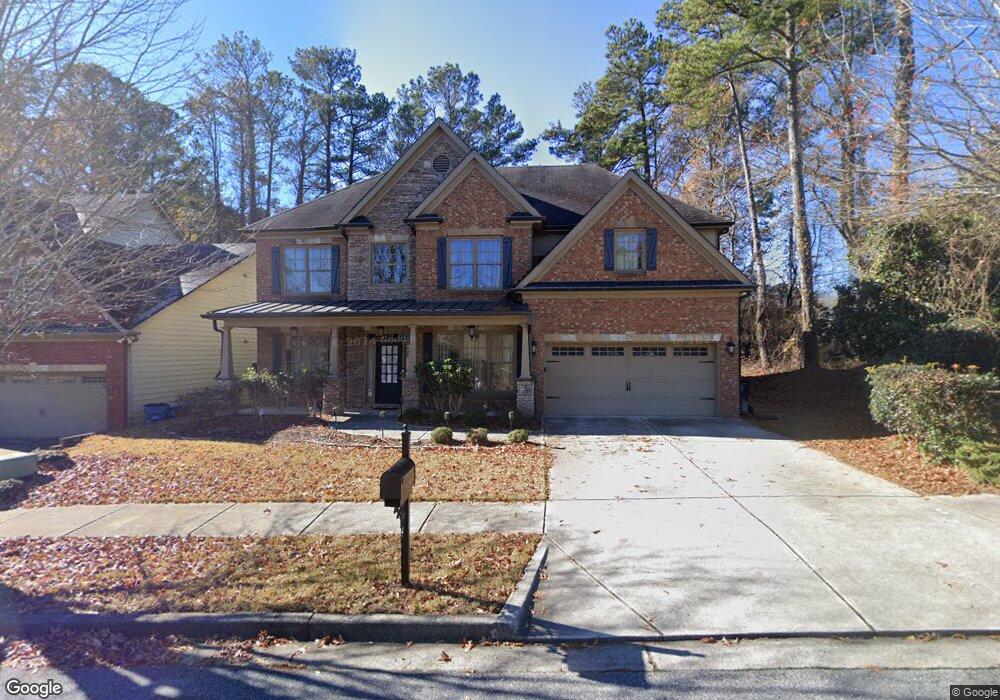
1982 Binnies Way Buford, GA 30519
Estimated Value: $480,172 - $555,000
5
Beds
3
Baths
3,200
Sq Ft
$162/Sq Ft
Est. Value
About This Home
This home is located at 1982 Binnies Way, Buford, GA 30519 and is currently estimated at $519,043, approximately $162 per square foot. 1982 Binnies Way is a home located in Gwinnett County with nearby schools including Freeman's Mill Elementary School, Twin Rivers Middle School, and Mountain View High School.
Ownership History
Date
Name
Owned For
Owner Type
Purchase Details
Closed on
Jan 5, 2010
Sold by
Leverette P Inc
Bought by
Synergy Fund Ii Llc
Current Estimated Value
Purchase Details
Closed on
May 12, 2009
Sold by
Tseng Hsuan C
Bought by
Tseng Hsuan C and Lu Yi
Home Financials for this Owner
Home Financials are based on the most recent Mortgage that was taken out on this home.
Original Mortgage
$191,920
Interest Rate
4.79%
Mortgage Type
New Conventional
Purchase Details
Closed on
Aug 29, 2006
Sold by
Ahk Llc
Bought by
Leverette P Inc
Home Financials for this Owner
Home Financials are based on the most recent Mortgage that was taken out on this home.
Original Mortgage
$3,900,000
Interest Rate
6.52%
Purchase Details
Closed on
Jun 14, 2006
Sold by
Leprechaun Investors Llc
Bought by
Ahk Llc
Home Financials for this Owner
Home Financials are based on the most recent Mortgage that was taken out on this home.
Original Mortgage
$297,000
Interest Rate
6.49%
Create a Home Valuation Report for This Property
The Home Valuation Report is an in-depth analysis detailing your home's value as well as a comparison with similar homes in the area
Home Values in the Area
Average Home Value in this Area
Purchase History
| Date | Buyer | Sale Price | Title Company |
|---|---|---|---|
| Synergy Fund Ii Llc | $460,178 | -- | |
| Tseng Hsuan C | -- | -- | |
| Tseng Hsuan C | $239,900 | -- | |
| Leverette P Inc | $1,275,000 | -- | |
| Ahk Llc | $73,000 | -- |
Source: Public Records
Mortgage History
| Date | Status | Borrower | Loan Amount |
|---|---|---|---|
| Previous Owner | Tseng Hsuan C | $191,920 | |
| Previous Owner | Leverette P Inc | $3,900,000 | |
| Previous Owner | Ahk Llc | $297,000 |
Source: Public Records
Tax History Compared to Growth
Tax History
| Year | Tax Paid | Tax Assessment Tax Assessment Total Assessment is a certain percentage of the fair market value that is determined by local assessors to be the total taxable value of land and additions on the property. | Land | Improvement |
|---|---|---|---|---|
| 2025 | $6,421 | $172,720 | $26,000 | $146,720 |
| 2024 | $4,728 | $172,720 | $26,000 | $146,720 |
| 2023 | $4,728 | $172,720 | $26,000 | $146,720 |
| 2022 | $5,227 | $172,720 | $26,000 | $146,720 |
| 2021 | $4,318 | $125,560 | $26,000 | $99,560 |
| 2020 | $4,229 | $120,120 | $23,760 | $96,360 |
| 2019 | $4,092 | $120,120 | $23,760 | $96,360 |
| 2018 | $3,777 | $105,320 | $23,760 | $81,560 |
| 2016 | $3,758 | $103,880 | $19,200 | $84,680 |
| 2015 | $3,799 | $103,880 | $19,200 | $84,680 |
| 2014 | -- | $91,160 | $19,200 | $71,960 |
Source: Public Records
Map
Nearby Homes
- 1965 Holland Park Dr NE
- 1867 Willoughby Dr
- 2066 Holland Creek Ct
- 2053 Arbor Springs Way
- 1717 Willoughby Dr
- 1810 Sunset Harbour Pointe Unit 6
- 2032 Shin Ct NE
- 2170 Peachford Ln
- 1846 Dorminey Ct Unit 2
- 1573 Vinings Ct
- 1799 Braselton Hwy
- 2159 Shin Ct
- 1939 Sunny Hill Rd
- 2159 Sunny Hill Rd
- 2199 Sunny Hill Rd
- 1580 Woodpoint Way
- 2346 Hampton Park Dr Unit I
- 1798 Braselton Hwy
- 1876 Hanover West Dr
- 1721 Crowes Lake Ct Unit 1
- 1972 Binnies Way
- 1972 Binnies Way
- 1972 Binnies Way Unit 1972
- 1972 Binnies Way
- 1981 Binnies Way
- 2139 Georgia 124
- 2067 Georgia 124
- 2169 Georgia 124
- 2209 Georgia 124
- 2097 Georgia 124
- 1962 Binnies Way
- 2116 Roberts View Trail
- 2107 Roberts View Trail
- 2012 Binnies Way
- 1961 Binnies Way
- 1952 Binnies Way
- 2117 Roberts View Trail
- 2126 Roberts View Trail Unit 75
- 2127 Roberts View Trail
- 1942 Binnies Way