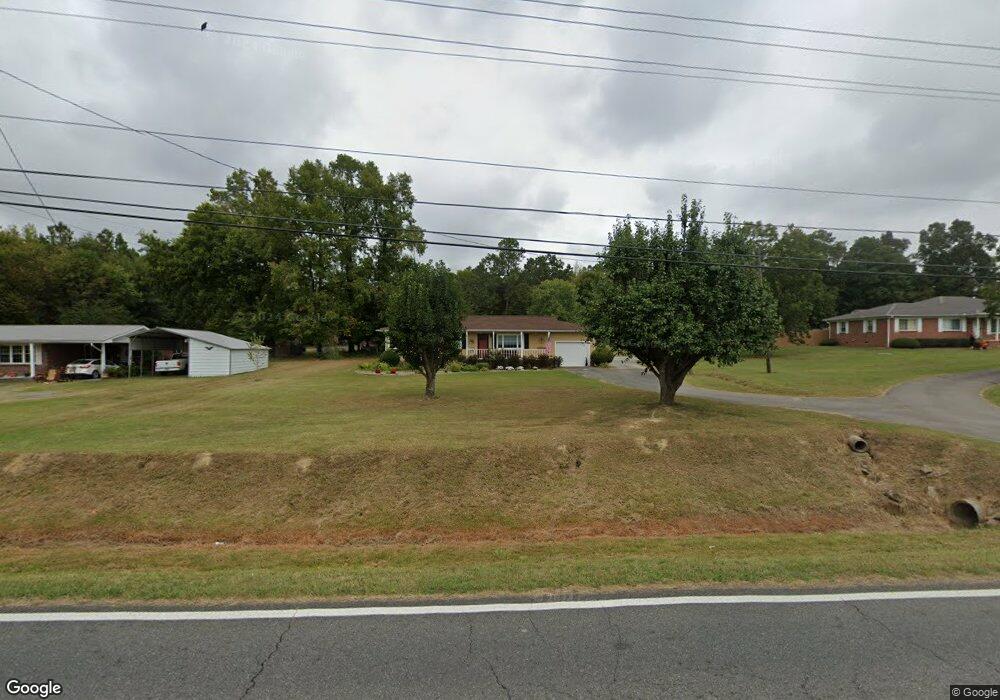
1982 Dews Pond Rd NE Calhoun, GA 30701
Estimated Value: $180,137 - $240,000
3
Beds
1
Bath
1,344
Sq Ft
$158/Sq Ft
Est. Value
About This Home
This home is located at 1982 Dews Pond Rd NE, Calhoun, GA 30701 and is currently estimated at $211,784, approximately $157 per square foot. 1982 Dews Pond Rd NE is a home located in Gordon County with nearby schools including Red Bud Elementary School.
Ownership History
Date
Name
Owned For
Owner Type
Purchase Details
Closed on
Oct 10, 2023
Sold by
Moore Richard Dennis
Bought by
Moore Richard Dennis and Moore Sandra Lee
Current Estimated Value
Purchase Details
Closed on
Jun 17, 2011
Sold by
Moore Richard D
Bought by
Moore Richard D and Moore Sandra L
Purchase Details
Closed on
Sep 17, 2010
Sold by
Brown Jeff
Bought by
Moore Richard D
Purchase Details
Closed on
Jan 18, 2010
Sold by
Household Realty Corp
Bought by
Brown Jeff
Purchase Details
Closed on
Sep 1, 2009
Sold by
Daugherty George E
Bought by
Household Realty Corporation
Purchase Details
Closed on
Mar 19, 1999
Bought by
Daugherty George E
Purchase Details
Closed on
Jul 22, 1994
Bought by
Goble R Daryl
Purchase Details
Closed on
Feb 26, 1994
Bought by
Kasha Goble R and Kasha Graham
Create a Home Valuation Report for This Property
The Home Valuation Report is an in-depth analysis detailing your home's value as well as a comparison with similar homes in the area
Home Values in the Area
Average Home Value in this Area
Purchase History
| Date | Buyer | Sale Price | Title Company |
|---|---|---|---|
| Moore Richard Dennis | $76,700 | -- | |
| Moore Richard D | -- | -- | |
| Moore Richard D | $88,700 | -- | |
| Brown Jeff | $26,500 | -- | |
| Household Realty Corporation | $50,400 | -- | |
| Household Realty Corp | $50,423 | -- | |
| Daugherty George E | $62,000 | -- | |
| Goble R Daryl | -- | -- | |
| Kasha Goble R | $49,500 | -- |
Source: Public Records
Tax History Compared to Growth
Tax History
| Year | Tax Paid | Tax Assessment Tax Assessment Total Assessment is a certain percentage of the fair market value that is determined by local assessors to be the total taxable value of land and additions on the property. | Land | Improvement |
|---|---|---|---|---|
| 2024 | $362 | $40,720 | $3,480 | $37,240 |
| 2023 | $330 | $38,480 | $3,480 | $35,000 |
| 2022 | $329 | $36,560 | $3,480 | $33,080 |
| 2021 | $619 | $24,080 | $3,480 | $20,600 |
| 2020 | $631 | $24,040 | $3,480 | $20,560 |
| 2019 | $635 | $24,040 | $3,480 | $20,560 |
| 2018 | $604 | $22,960 | $3,480 | $19,480 |
| 2017 | $587 | $21,800 | $3,480 | $18,320 |
| 2016 | $588 | $21,800 | $3,480 | $18,320 |
| 2015 | $582 | $21,400 | $3,480 | $17,920 |
| 2014 | $545 | $20,708 | $3,507 | $17,202 |
Source: Public Records
Map
Nearby Homes
- 114 Sycamore Ln
- 116 Sycamore Ln
- 102 Sycamore Ln
- 118 Sycamore Ln
- 113 Sycamore Ln
- 111 Sycamore Ln
- 216 Sycamore Dr
- The Crawford Plan at Sycamore Crest
- The Benson II Plan at Sycamore Crest
- The Norwood II Plan at Sterling at the Villages
- The Piedmont Plan at Sycamore Crest
- The Caldwell Plan at Sycamore Crest
- The McGinnis Plan at Sycamore Crest
- The Bradley Plan at Sycamore Crest
- The Harrington Plan at Sycamore Crest
- 225 Sycamore Dr
- 126 Summerfield Ln NE
- 129 Green Meadow Ln NE
- 1970 Dews Pond Rd NE
- 1994 Dews Pond Rd NE
- 1958 Dews Pond Rd NE
- 1952 Dews Pond Rd NE
- 2016 Dews Pond Rd NE
- 1954 Moss Dr
- 1985 Dews Pond Rd SE
- 1929 Dews Pond Rd SE
- 1863 Dews Pond Rd SE
- 1995 Dews Pond Rd SE
- 2091 Dews Pond Rd SE
- 260 Colonial Way NE
- 2092 Dews Pond Rd NE
- 2080 Dews Pond Rd NE
- 2107 Dews Pond Rd SE
- 2107 Dews Pond Rd SE
- 2107 Dew''S Pond Rd SE
- 2107 Dews Pond Rd SE
- 2096 Dews Pond Rd NE
- 248 Colonial Way NE