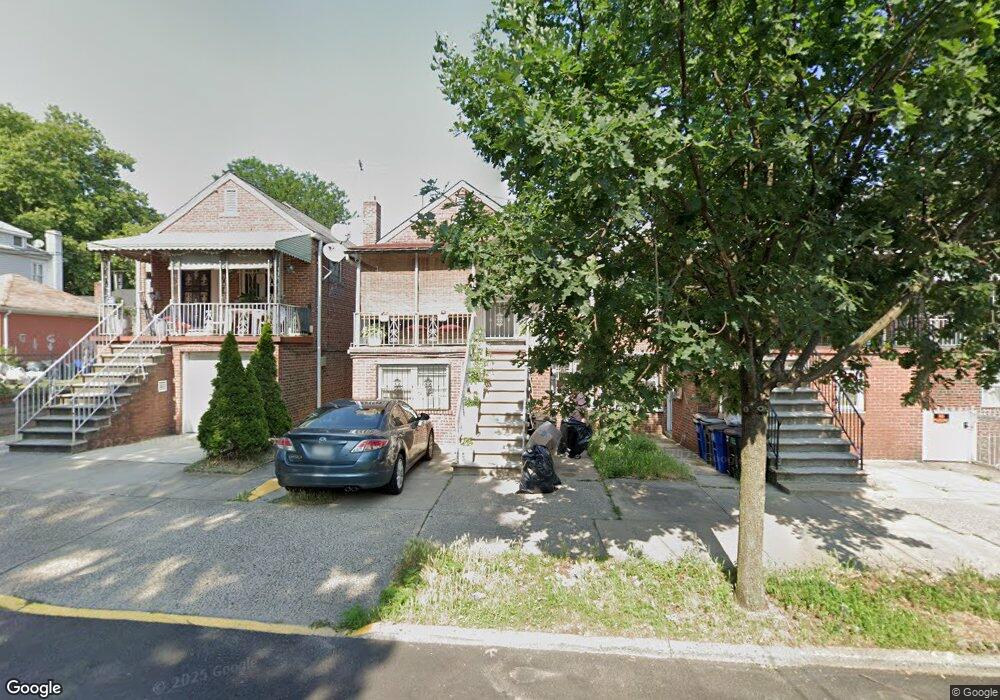
1982 Matthews Ave Bronx, NY 10462
Morris Park NeighborhoodEstimated Value: $721,061 - $910,000
--
Bed
--
Bath
2,044
Sq Ft
$410/Sq Ft
Est. Value
About This Home
This home is located at 1982 Matthews Ave, Bronx, NY 10462 and is currently estimated at $838,265, approximately $410 per square foot. 1982 Matthews Ave is a home located in Bronx County with nearby schools including P.S. 083 The Donald Hertz School, Bronx Excellence 2, and Bronx Charter School For Excellence 2.
Ownership History
Date
Name
Owned For
Owner Type
Purchase Details
Closed on
Nov 27, 2006
Sold by
Jimenez Magdali
Bought by
Cruz Allen
Current Estimated Value
Home Financials for this Owner
Home Financials are based on the most recent Mortgage that was taken out on this home.
Original Mortgage
$399,640
Outstanding Balance
$237,152
Interest Rate
6.36%
Mortgage Type
Purchase Money Mortgage
Estimated Equity
$601,113
Purchase Details
Closed on
Sep 13, 2002
Sold by
Jiminez Migdali
Bought by
Jimenez Magdali
Home Financials for this Owner
Home Financials are based on the most recent Mortgage that was taken out on this home.
Original Mortgage
$190,000
Interest Rate
6.07%
Purchase Details
Closed on
Apr 30, 1996
Sold by
Troise Anthony and Troise Mae
Bought by
Troise Mae
Create a Home Valuation Report for This Property
The Home Valuation Report is an in-depth analysis detailing your home's value as well as a comparison with similar homes in the area
Home Values in the Area
Average Home Value in this Area
Purchase History
| Date | Buyer | Sale Price | Title Company |
|---|---|---|---|
| Cruz Allen | $499,550 | -- | |
| Cruz Allen | $499,550 | -- | |
| Jimenez Magdali | -- | -- | |
| Jimenez Magdali | -- | -- | |
| Troise Mae | -- | Chicago Title Insurance Co | |
| Troise Mae | -- | Chicago Title Insurance Co |
Source: Public Records
Mortgage History
| Date | Status | Borrower | Loan Amount |
|---|---|---|---|
| Open | Cruz Allen | $399,640 | |
| Closed | Cruz Allen | $399,640 | |
| Previous Owner | Jimenez Magdali | $190,000 |
Source: Public Records
Tax History Compared to Growth
Tax History
| Year | Tax Paid | Tax Assessment Tax Assessment Total Assessment is a certain percentage of the fair market value that is determined by local assessors to be the total taxable value of land and additions on the property. | Land | Improvement |
|---|---|---|---|---|
| 2025 | $6,137 | $33,872 | $6,530 | $27,342 |
| 2024 | $6,137 | $31,955 | $7,004 | $24,951 |
| 2023 | $5,838 | $30,146 | $5,783 | $24,363 |
| 2022 | $5,390 | $46,260 | $9,600 | $36,660 |
| 2021 | $5,682 | $37,560 | $9,600 | $27,960 |
| 2020 | $5,679 | $39,060 | $9,600 | $29,460 |
| 2019 | $5,278 | $33,480 | $9,600 | $23,880 |
| 2018 | $4,823 | $25,122 | $7,402 | $17,720 |
| 2017 | $4,532 | $23,700 | $9,600 | $14,100 |
| 2016 | $4,827 | $25,694 | $8,841 | $16,853 |
| 2015 | $2,895 | $24,240 | $10,680 | $13,560 |
| 2014 | $2,895 | $24,240 | $10,680 | $13,560 |
Source: Public Records
Map
Nearby Homes
- 1916 Barnes Ave
- 1907 Barnes Ave
- 1961 Wallace Ave
- 1904 Bronxdale Ave
- 1869 Muliner Ave
- 1914 Holland Ave
- 1925 Bogart Ave
- 1858 Wallace Ave
- 928 Rhinelander Ave
- 762 Brady Ave Unit 221
- 762 Brady Ave Unit 621
- 953 Rhinelander Ave
- 758 Brady Ave Unit 411
- 758 Brady Ave Unit 214
- 760 Brady Ave Unit 417
- 760 Brady Ave Unit 117
- 754 Brady Ave Unit 303
- 756 Brady Ave Unit 507
- 1847 Bronxdale Ave
- 2075 Wallace Ave Unit 546
- 1984 Matthews Ave
- 1986 Matthews Ave
- 1980 Matthews Ave
- 1980 Matthews Ave Unit 1
- 1980 Matthews Ave Unit 2
- 1980 Mathews Ave
- 1976 Matthews Ave
- 828 Neill Ave
- 824 Neill Ave Unit 826
- 824-826 Neill Ave
- 1974 Matthews Ave
- 1989 Muliner Ave
- 1991 Muliner Ave
- 834 Neill Ave
- 1947 Muliner Ave
- 830 Neill Ave
- 836 Neill Ave
- 822 Neill Ave
- 1943 Muliner Ave
- 1972 Matthews Ave