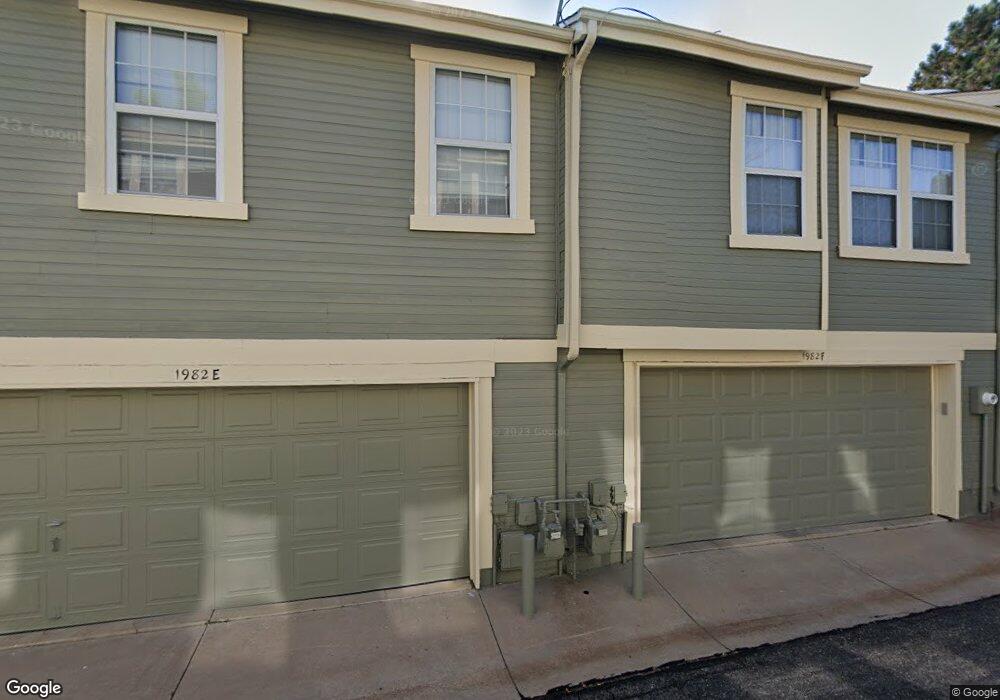
1982 S Hannibal Ct Unit D Aurora, CO 80013
Horseshoe Park NeighborhoodEstimated Value: $342,000 - $390,000
2
Beds
3
Baths
1,300
Sq Ft
$276/Sq Ft
Est. Value
About This Home
This home is located at 1982 S Hannibal Ct Unit D, Aurora, CO 80013 and is currently estimated at $359,182, approximately $276 per square foot. 1982 S Hannibal Ct Unit D is a home located in Arapahoe County with nearby schools including Yale Elementary School, Columbia Middle School, and Gateway High School.
Ownership History
Date
Name
Owned For
Owner Type
Purchase Details
Closed on
Mar 12, 1999
Sold by
Dunn Ree Llc
Bought by
Herrera Consuelo
Current Estimated Value
Home Financials for this Owner
Home Financials are based on the most recent Mortgage that was taken out on this home.
Original Mortgage
$92,650
Interest Rate
6.74%
Mortgage Type
Balloon
Purchase Details
Closed on
Dec 28, 1998
Sold by
Vaccaro Paul V
Bought by
Dunn Re Llc
Purchase Details
Closed on
May 29, 1997
Sold by
Gonzalez Ramon and Gonzalez Benita
Bought by
Vaccaro Paul V
Purchase Details
Closed on
Jul 2, 1991
Sold by
Krist James M Krist Jan M
Bought by
Gonzalez Benita Gonzalez Ramon
Purchase Details
Closed on
Jan 26, 1988
Sold by
Conversion Arapco
Bought by
Krist James M Krist Jan M
Purchase Details
Closed on
Jul 4, 1776
Bought by
Conversion Arapco
Create a Home Valuation Report for This Property
The Home Valuation Report is an in-depth analysis detailing your home's value as well as a comparison with similar homes in the area
Home Values in the Area
Average Home Value in this Area
Purchase History
| Date | Buyer | Sale Price | Title Company |
|---|---|---|---|
| Herrera Consuelo | $109,000 | North American Title Co | |
| Dunn Re Llc | -- | -- | |
| Vaccaro Paul V | $102,500 | -- | |
| Gonzalez Benita Gonzalez Ramon | -- | -- | |
| Krist James M Krist Jan M | -- | -- | |
| Conversion Arapco | -- | -- |
Source: Public Records
Mortgage History
| Date | Status | Borrower | Loan Amount |
|---|---|---|---|
| Closed | Herrera Consuelo | $92,650 |
Source: Public Records
Tax History Compared to Growth
Tax History
| Year | Tax Paid | Tax Assessment Tax Assessment Total Assessment is a certain percentage of the fair market value that is determined by local assessors to be the total taxable value of land and additions on the property. | Land | Improvement |
|---|---|---|---|---|
| 2024 | $1,382 | $21,567 | -- | -- |
| 2023 | $1,382 | $21,567 | $0 | $0 |
| 2022 | $1,170 | $18,605 | $0 | $0 |
| 2021 | $1,208 | $18,605 | $0 | $0 |
| 2020 | $1,127 | $17,975 | $0 | $0 |
| 2019 | $1,862 | $17,975 | $0 | $0 |
| 2018 | $1,532 | $14,486 | $0 | $0 |
| 2017 | $1,333 | $14,486 | $0 | $0 |
| 2016 | $1,120 | $11,924 | $0 | $0 |
| 2015 | $1,081 | $11,924 | $0 | $0 |
| 2014 | -- | $7,681 | $0 | $0 |
| 2013 | -- | $8,990 | $0 | $0 |
Source: Public Records
Map
Nearby Homes
- 1920 S Hannibal St Unit A
- 1990 S Helena St Unit H
- 1920 S Helena St Unit A
- 1910 S Helena St Unit B
- 1962 S Ivory Way
- 2062 S Helena St Unit C
- 2082 S Helena St Unit A
- 1849 S Helena St
- 14989 E Pacific Place
- 15532 E Pacific Place
- 15173 E Utah Place
- 2150 S Idalia St
- 14867 E Pacific Place
- 15675 E Atlantic Cir
- 15671 E Atlantic Cir
- 1701 S Granby St
- 15650 E Mexico Ave
- 1601 S Idalia Cir Unit A
- 1639 S Ivory Cir Unit G
- 1649 S Ivory Cir Unit A
- 1982 S Hannibal Ct Unit G
- 1982 S Hannibal Ct Unit F
- 1982 S Hannibal Ct Unit E
- 1982 S Hannibal Ct Unit C
- 1982 S Hannibal Ct Unit B
- 1982 S Hannibal Ct Unit A
- 1981 S Hannibal Ct Unit A
- 1981 S Hannibal Ct Unit C
- 1981 S Hannibal Ct Unit D
- 1981 S Hannibal Ct Unit F
- 1981 S Hannibal Ct Unit G
- 1980 S Hannibal St Unit G
- 1980 S Hannibal St Unit F
- 1980 S Hannibal St Unit E
- 1980 S Hannibal St Unit D
- 1980 S Hannibal St Unit C
- 1980 S Hannibal St Unit B
- 1980 S Hannibal St Unit A
- 2001 S Helena St Unit A
- 2001 S Helena St Unit B