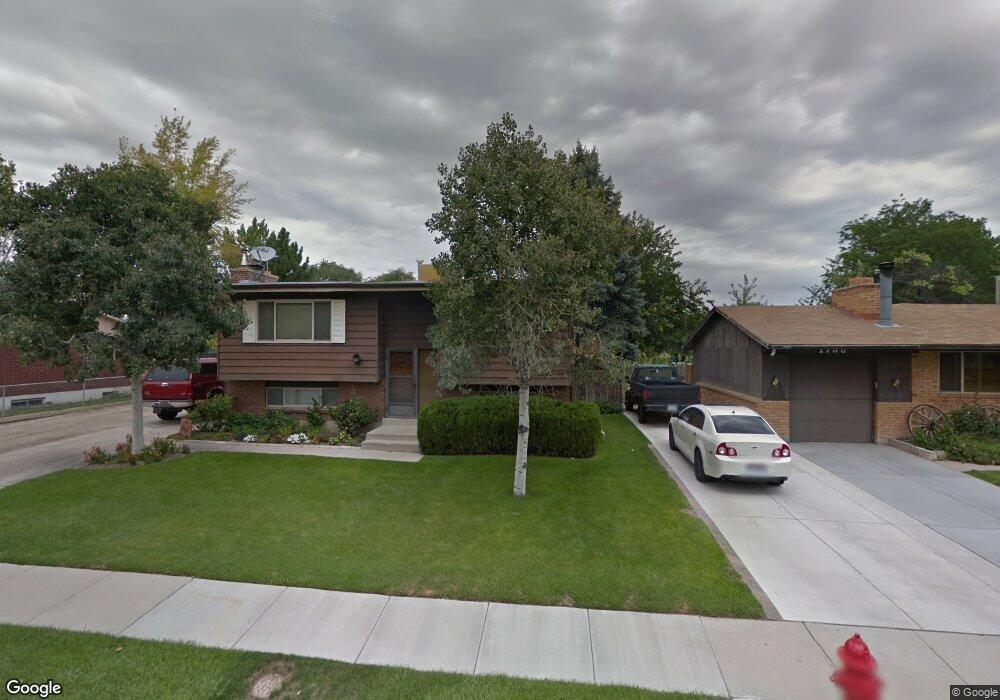
1982 W 7125 S West Jordan, UT 84084
Estimated Value: $491,000 - $547,000
4
Beds
2
Baths
1,716
Sq Ft
$309/Sq Ft
Est. Value
About This Home
This home is located at 1982 W 7125 S, West Jordan, UT 84084 and is currently estimated at $530,230, approximately $308 per square foot. 1982 W 7125 S is a home located in Salt Lake County with nearby schools including Majestic Elementary Arts Academy, West Jordan Middle School, and West Jordan High School.
Ownership History
Date
Name
Owned For
Owner Type
Purchase Details
Closed on
Jul 26, 2024
Sold by
Blackburn William M
Bought by
Blackburn Brittan G
Current Estimated Value
Purchase Details
Closed on
Jul 26, 2022
Sold by
Bobbie Ohm
Bought by
Blackburn Brittan G and Blackburn William M
Home Financials for this Owner
Home Financials are based on the most recent Mortgage that was taken out on this home.
Original Mortgage
$502,550
Interest Rate
5.81%
Mortgage Type
New Conventional
Purchase Details
Closed on
Oct 23, 2017
Sold by
Bowden Michael Lamar and Bowden Patricia Taylor
Bought by
Ohm Bobbie
Home Financials for this Owner
Home Financials are based on the most recent Mortgage that was taken out on this home.
Original Mortgage
$275,000
Interest Rate
3.78%
Mortgage Type
VA
Purchase Details
Closed on
Sep 11, 2013
Sold by
Bowden Michael L and Bowden Patricia T
Bought by
Bowden Michael Lamar and Bowden Patricia Taylor
Create a Home Valuation Report for This Property
The Home Valuation Report is an in-depth analysis detailing your home's value as well as a comparison with similar homes in the area
Home Values in the Area
Average Home Value in this Area
Purchase History
| Date | Buyer | Sale Price | Title Company |
|---|---|---|---|
| Blackburn Brittan G | -- | None Listed On Document | |
| Blackburn Brittan G | -- | Meridian Title | |
| Ohm Bobbie | -- | First American Title | |
| Bowden Michael Lamar | -- | None Available |
Source: Public Records
Mortgage History
| Date | Status | Borrower | Loan Amount |
|---|---|---|---|
| Previous Owner | Blackburn Brittan G | $502,550 | |
| Previous Owner | Ohm Bobbie | $275,000 |
Source: Public Records
Tax History Compared to Growth
Tax History
| Year | Tax Paid | Tax Assessment Tax Assessment Total Assessment is a certain percentage of the fair market value that is determined by local assessors to be the total taxable value of land and additions on the property. | Land | Improvement |
|---|---|---|---|---|
| 2025 | $2,464 | $517,500 | $209,400 | $308,100 |
| 2024 | $2,464 | $474,100 | $201,300 | $272,800 |
| 2023 | $2,568 | $465,600 | $199,400 | $266,200 |
| 2022 | $2,408 | $429,600 | $195,500 | $234,100 |
| 2021 | $85 | $314,500 | $162,900 | $151,600 |
| 2020 | $40 | $302,600 | $162,900 | $139,700 |
| 2019 | $1,574 | $288,200 | $136,800 | $151,400 |
| 2018 | $1,778 | $263,500 | $127,400 | $136,100 |
| 2017 | $1,487 | $219,500 | $127,400 | $92,100 |
| 2016 | $1,484 | $205,700 | $127,400 | $78,300 |
| 2015 | $1,574 | $212,800 | $129,800 | $83,000 |
| 2014 | $1,435 | $191,000 | $117,700 | $73,300 |
Source: Public Records
Map
Nearby Homes
- 1951 W 7125 S
- 7150 Camelot Way
- 7149 S Camelot Way
- 6925 S Lexington Dr
- 7279 S Kenadi Ct
- 6924 S 2160 W
- 2312 W Hidden Bend Cove Unit 107
- 1718 W Trey Way Unit 2
- 1607 W Beamon St
- 7118 S Equator Ln Unit 14 B
- 2421 W 6900 S
- 7165 Callie Dr
- 7174 S 1380 W
- 6683 Alice Susanna Ln
- 7194 S 1380 W
- 1678 Leland Dr
- 1817 W 7600 S Unit I204
- 2169 W 7600 S
- 7645 S 1960 W
- 2510 W Jordan Meadows Ln
- 1968 W 7125 S
- 2018 W 7125 S
- 1956 W 7125 S
- 2005 W 7125 S
- 1971 W 7125 S
- 2030 W 7125 S
- 2021 W 7125 S
- 1961 W 7125 S
- 1942 W 7125 S
- 2035 W 7125 S
- 2042 W 7125 S
- 2004 Camelot Way
- 1970 Camelot Way
- 2020 Camelot Way
- 2020 W Camelot Way
- 2047 W 7125 S
- 7120 Camelot Way
- 1960 W Camelot Way
- 1960 Camelot Way
- 2056 W 7125 S