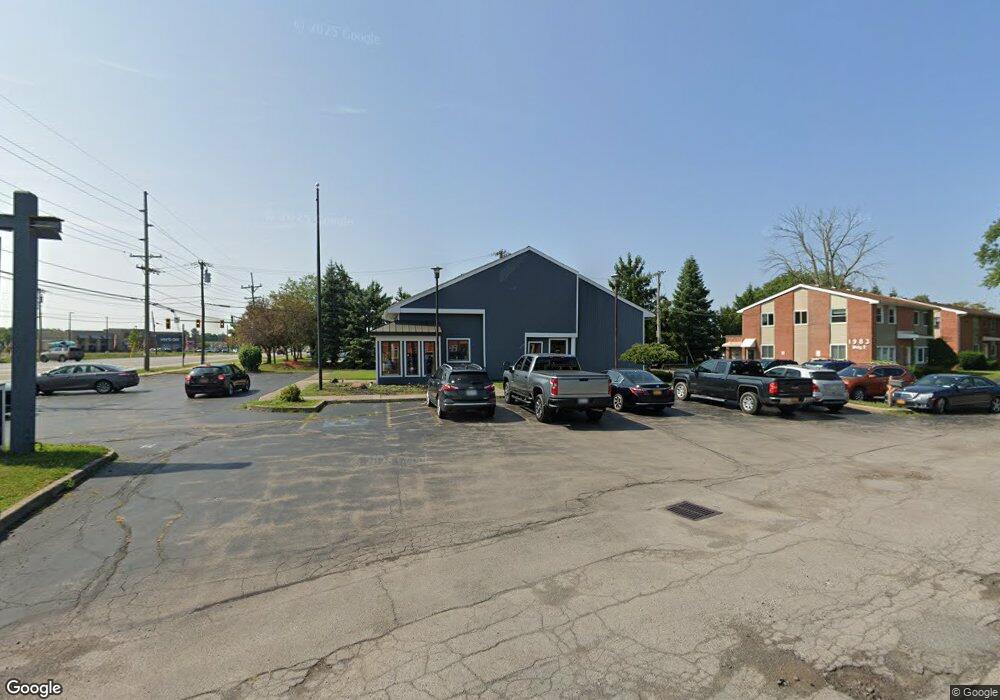
1983 Empire Blvd Webster, NY 14580
Estimated Value: $2,207,138
Studio
--
Bath
1,340
Sq Ft
$1,647/Sq Ft
Est. Value
About This Home
This home is located at 1983 Empire Blvd, Webster, NY 14580 and is currently estimated at $2,207,138, approximately $1,647 per square foot. 1983 Empire Blvd is a home located in Monroe County with nearby schools including Plank Road North Elementary School, Spry Middle School, and Webster-Schroeder High School.
Ownership History
Date
Name
Owned For
Owner Type
Purchase Details
Closed on
Aug 28, 2023
Sold by
Aveline Properties Llc
Bought by
Baytowne Real Estate Holdings Llc
Current Estimated Value
Home Financials for this Owner
Home Financials are based on the most recent Mortgage that was taken out on this home.
Original Mortgage
$1,504,000
Outstanding Balance
$1,472,102
Interest Rate
6.96%
Mortgage Type
New Conventional
Estimated Equity
$735,036
Purchase Details
Closed on
Jul 31, 2018
Sold by
Tyrolia Properties Llc
Bought by
Aveline Properties Llc
Home Financials for this Owner
Home Financials are based on the most recent Mortgage that was taken out on this home.
Original Mortgage
$1,450,000
Interest Rate
4.6%
Mortgage Type
Seller Take Back
Purchase Details
Closed on
Jul 22, 2008
Sold by
Demanincor Thomas
Bought by
Tyrolia Properties Llc
Create a Home Valuation Report for This Property
The Home Valuation Report is an in-depth analysis detailing your home's value as well as a comparison with similar homes in the area
Home Values in the Area
Average Home Value in this Area
Purchase History
| Date | Buyer | Sale Price | Title Company |
|---|---|---|---|
| Baytowne Real Estate Holdings Llc | -- | Network Title Agency Of New Yo | |
| Aveline Properties Llc | -- | None Available | |
| Tyrolia Properties Llc | -- | -- |
Source: Public Records
Mortgage History
| Date | Status | Borrower | Loan Amount |
|---|---|---|---|
| Open | Baytowne Real Estate Holdings Llc | $1,504,000 | |
| Previous Owner | Aveline Properties Llc | $1,450,000 |
Source: Public Records
Tax History
| Year | Tax Paid | Tax Assessment Tax Assessment Total Assessment is a certain percentage of the fair market value that is determined by local assessors to be the total taxable value of land and additions on the property. | Land | Improvement |
|---|---|---|---|---|
| 2024 | $10,901 | $398,200 | $165,400 | $232,800 |
| 2023 | $11,342 | $398,200 | $165,400 | $232,800 |
| 2022 | $12,863 | $398,200 | $165,400 | $232,800 |
| 2021 | $12,163 | $330,400 | $124,800 | $205,600 |
| 2020 | $11,975 | $330,400 | $124,800 | $205,600 |
| 2019 | $11,306 | $330,400 | $124,800 | $205,600 |
| 2018 | $11,539 | $330,400 | $124,800 | $205,600 |
| 2017 | $7,025 | $330,400 | $124,800 | $205,600 |
| 2016 | $11,306 | $330,400 | $124,800 | $205,600 |
| 2015 | -- | $330,400 | $124,800 | $205,600 |
| 2014 | -- | $330,400 | $124,800 | $205,600 |
Source: Public Records
Map
Nearby Homes
- 97 Seabury Blvd
- 1166 Bay Rd
- 439 Tara Ln
- 10 Bay Park
- 70 Avalon Trail
- 1 Woods Point
- 60 Daytona Ave
- 1103 Hillsboro Cove Cir
- 6 Woodfield Dr
- 51 Walnut Hill Dr
- 302 Marina View Ln
- 1063 Hillsboro Cove Cir
- 734 Eastwood Cir
- 45 Armetale Luster
- 43 Longsworth Dr
- 355 Bay Village Dr
- 37 Southfield Dr
- 59 Cardogan Square
- Lot #30 Maple Dr
- 14 Braintree Crescent
- 1983 Empire Blvd-Lower LV
- 1983 Empire Blvd-Bldg 2l
- 1983 Empire Blvd-`L'
- 1983 Empire Blvd and 19-35 Terrel Dr
- 1983 Empire Blvd
- 1983 Empire - Bldg #2 Ll Blvd
- 27 Terrel Dr-Apt#6
- 27 Terrel Dr-Apt 7
- 27 Terrel Dr Unit 6
- 27 Terrel Dr Unit 5
- 27 Terrel Dr
- 1991 Empire Blvd
- 35 Terrel Dr
- 35 Terrel Dr Unit 4
- 35 Terrel Dr Unit 1
- 1991 Empire Blvd-Store #3
- 1991 Empire - Store #2 Blvd
- 1991 Empire Blvd - Apt Blvd
- 26 Terrel Dr
- 35 Terrel Dr-Apt 2
Your Personal Tour Guide
Ask me questions while you tour the home.