1983 N 450 W Clearfield, UT 84015
Estimated Value: $362,000 - $417,000
4
Beds
1
Bath
1,250
Sq Ft
$306/Sq Ft
Est. Value
About This Home
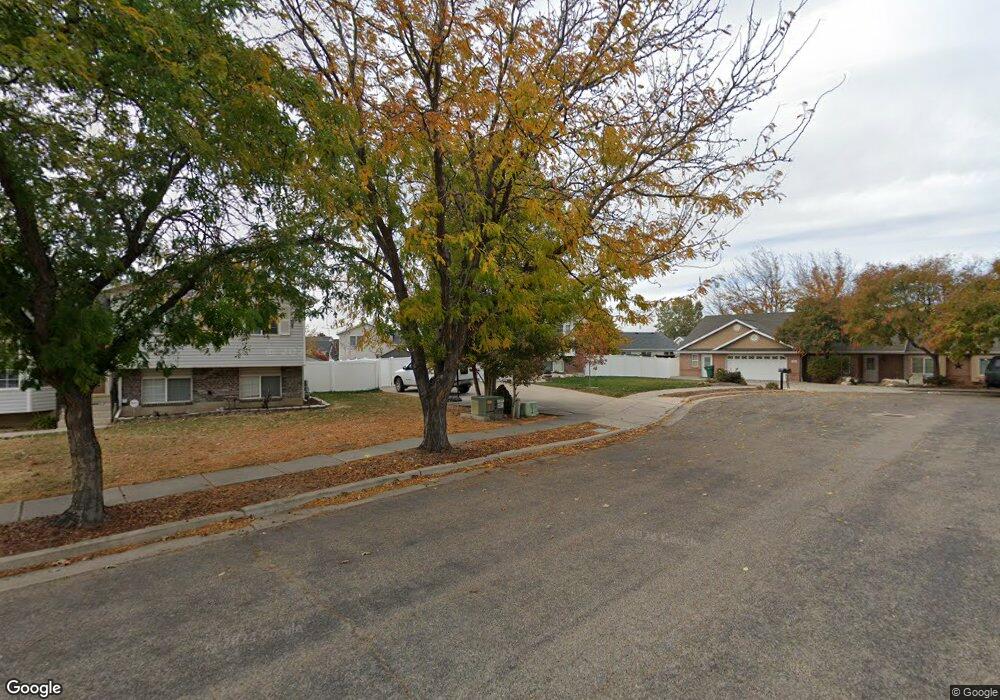
This home is located at 1983 N 450 W, Clearfield, UT 84015 and is currently estimated at $383,055, approximately $306 per square foot. 1983 N 450 W is a home located in Davis County with nearby schools including Sunset School, Sunset Junior High School, and Northridge High School.
Ownership History
Date
Name
Owned For
Owner Type
Purchase Details
Closed on
Feb 22, 2024
Sold by
Morain Cliff R
Bought by
Morain Cliff R and Cragun Melanie
Current Estimated Value
Purchase Details
Closed on
Jan 29, 2007
Sold by
Beneficial Mortgage Co Of Utah
Bought by
Morain Cliff R
Home Financials for this Owner
Home Financials are based on the most recent Mortgage that was taken out on this home.
Original Mortgage
$88,000
Interest Rate
6.17%
Mortgage Type
New Conventional
Purchase Details
Closed on
Dec 18, 2006
Sold by
Heinbach Joseph A and Heinbach Julie E
Bought by
Beneficial Mortgage Co Of Utah
Home Financials for this Owner
Home Financials are based on the most recent Mortgage that was taken out on this home.
Original Mortgage
$88,000
Interest Rate
6.17%
Mortgage Type
New Conventional
Purchase Details
Closed on
Sep 22, 2005
Sold by
Heinbach Julie R
Bought by
Heinbach Joseph A
Create a Home Valuation Report for This Property
The Home Valuation Report is an in-depth analysis detailing your home's value as well as a comparison with similar homes in the area
Home Values in the Area
Average Home Value in this Area
Purchase History
| Date | Buyer | Sale Price | Title Company |
|---|---|---|---|
| Morain Cliff R | -- | None Listed On Document | |
| Morain Cliff R | -- | Backman Title Services | |
| Beneficial Mortgage Co Of Utah | $105,668 | Accommodation | |
| Heinbach Joseph A | -- | -- |
Source: Public Records
Mortgage History
| Date | Status | Borrower | Loan Amount |
|---|---|---|---|
| Previous Owner | Morain Cliff R | $88,000 |
Source: Public Records
Tax History Compared to Growth
Tax History
| Year | Tax Paid | Tax Assessment Tax Assessment Total Assessment is a certain percentage of the fair market value that is determined by local assessors to be the total taxable value of land and additions on the property. | Land | Improvement |
|---|---|---|---|---|
| 2025 | $1,803 | $180,400 | $99,814 | $80,586 |
| 2024 | $1,803 | $164,450 | $95,230 | $69,220 |
| 2023 | $1,683 | $280,000 | $149,705 | $130,295 |
| 2022 | $1,790 | $161,150 | $83,325 | $77,825 |
| 2021 | $1,527 | $216,000 | $102,658 | $113,342 |
| 2020 | $1,329 | $185,000 | $89,212 | $95,788 |
| 2019 | $1,268 | $181,000 | $92,245 | $88,755 |
| 2018 | $1,124 | $157,000 | $73,718 | $83,282 |
| 2016 | $976 | $70,070 | $34,943 | $35,127 |
| 2015 | $951 | $64,680 | $34,943 | $29,737 |
| 2014 | $944 | $65,617 | $34,943 | $30,674 |
| 2013 | -- | $60,391 | $25,438 | $34,953 |
Source: Public Records
Map
Nearby Homes
- 1746 N 475 W
- 2177 N 450 W
- 1721 N 400 W
- 1696 N 475 W
- 1874 N 200 W
- 648 W 2200 N
- 1974 N 75 W
- 52 W 2000 N
- 2085 N Main St Unit 409
- 2085 N Main St Unit 108
- 2085 N Main St Unit 401
- 2085 N Main St Unit 308
- 2085 N Main St Unit 116
- 2085 N Main St Unit 201
- 2085 N Main St Unit 402
- 2085 N Main St Unit 202
- 2085 N Main St Unit 301
- 2085 N Main St Unit 302
- 2085 N Main St Unit 115
- 36 W 1600 N