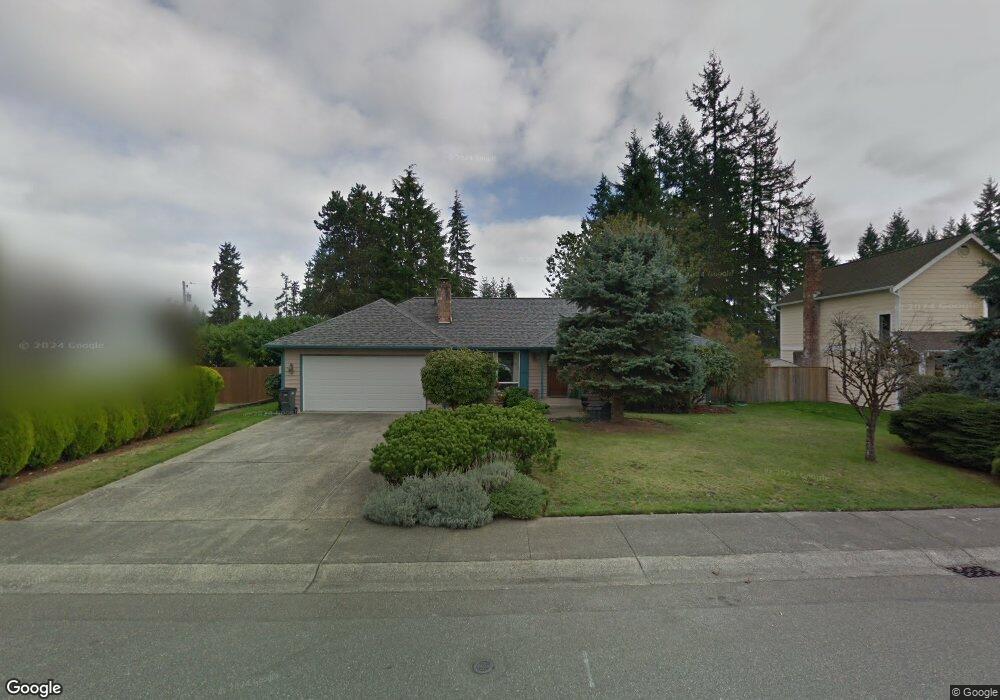
19833 8th Ave SE Bothell, WA 98012
Queensborough-Brentwood NeighborhoodEstimated Value: $683,000 - $938,000
3
Beds
2
Baths
1,308
Sq Ft
$636/Sq Ft
Est. Value
About This Home
This home is located at 19833 8th Ave SE, Bothell, WA 98012 and is currently estimated at $831,693, approximately $635 per square foot. 19833 8th Ave SE is a home located in Snohomish County with nearby schools including Crystal Springs Elementary School, Canyon Park Junior High School, and Bothell High School.
Ownership History
Date
Name
Owned For
Owner Type
Purchase Details
Closed on
Oct 25, 2017
Sold by
Peterson Cheri K
Bought by
Peterson Cheri K and Cheri K Peterson Trust
Current Estimated Value
Home Financials for this Owner
Home Financials are based on the most recent Mortgage that was taken out on this home.
Original Mortgage
$93,000
Interest Rate
3.78%
Mortgage Type
New Conventional
Purchase Details
Closed on
Oct 20, 2017
Sold by
Peterson Cheri K
Bought by
Peterson Cheri K
Home Financials for this Owner
Home Financials are based on the most recent Mortgage that was taken out on this home.
Original Mortgage
$93,000
Interest Rate
3.78%
Mortgage Type
New Conventional
Purchase Details
Closed on
Aug 1, 2015
Sold by
Peterson Cheri K
Bought by
Peterson Cheri K
Create a Home Valuation Report for This Property
The Home Valuation Report is an in-depth analysis detailing your home's value as well as a comparison with similar homes in the area
Home Values in the Area
Average Home Value in this Area
Purchase History
| Date | Buyer | Sale Price | Title Company |
|---|---|---|---|
| Peterson Cheri K | -- | Fidelity National Title | |
| Peterson Cheri K | -- | Fidelity National Title | |
| Peterson Cheri K | -- | None Available |
Source: Public Records
Mortgage History
| Date | Status | Borrower | Loan Amount |
|---|---|---|---|
| Closed | Peterson Cheri K | $93,000 |
Source: Public Records
Tax History
| Year | Tax Paid | Tax Assessment Tax Assessment Total Assessment is a certain percentage of the fair market value that is determined by local assessors to be the total taxable value of land and additions on the property. | Land | Improvement |
|---|---|---|---|---|
| 2025 | $946 | $742,600 | $470,000 | $272,600 |
| 2024 | $946 | $732,600 | $460,000 | $272,600 |
| 2023 | $889 | $898,100 | $630,000 | $268,100 |
| 2022 | $5,782 | $599,300 | $372,000 | $227,300 |
| 2020 | $5,256 | $506,600 | $311,000 | $195,600 |
| 2019 | $4,474 | $440,900 | $255,000 | $185,900 |
| 2018 | $4,207 | $390,800 | $225,000 | $165,800 |
| 2017 | $3,671 | $350,200 | $195,000 | $155,200 |
| 2016 | $3,488 | $322,100 | $173,000 | $149,100 |
Source: Public Records
Map
Nearby Homes
- 727 198th Place SE
- 19921 10th Dr SE
- 1126 199th St SE
- 20029 7th Ave SE
- 1216 199th St SE
- 820 Grimes Rd
- 20224 11th Dr SE
- 603 194th Place SE
- 1402 194th St SE Unit 1
- 1322 194th St SE Unit B4
- 1322 194th St SE Unit B7
- 1322 194th St SE Unit B2
- 1322 194th St SE Unit B1
- 1322 194th St SE Unit B6
- 429 203rd Place SE
- 20511 Greening Rd
- 1332 192nd St SE Unit 50
- 19726 Filbert Dr
- 20318 Bothell Everett Hwy Unit A303
- 1820 201st Place SE
- 19825 8th Ave SE
- 19901 8th Ave SE
- 19819 8th Ave SE
- 19907 8th Ave SE
- 19913 8th Ave SE
- 19902 8th Ave SE
- 829 Harvest Rd
- 907 Harvest Rd
- 19910 8th Ave SE
- 717 198th Place SE
- 19807 8th Ave SE
- 19820 8th Ave SE
- 909 Harvest Rd
- 19728 9th Dr SE
- 718 198th Place SE
- 19806 8th Ave SE
- 19724 9th Dr SE
- 19918 8th Ave SE
- 711 198th Place SE
Your Personal Tour Guide
Ask me questions while you tour the home.