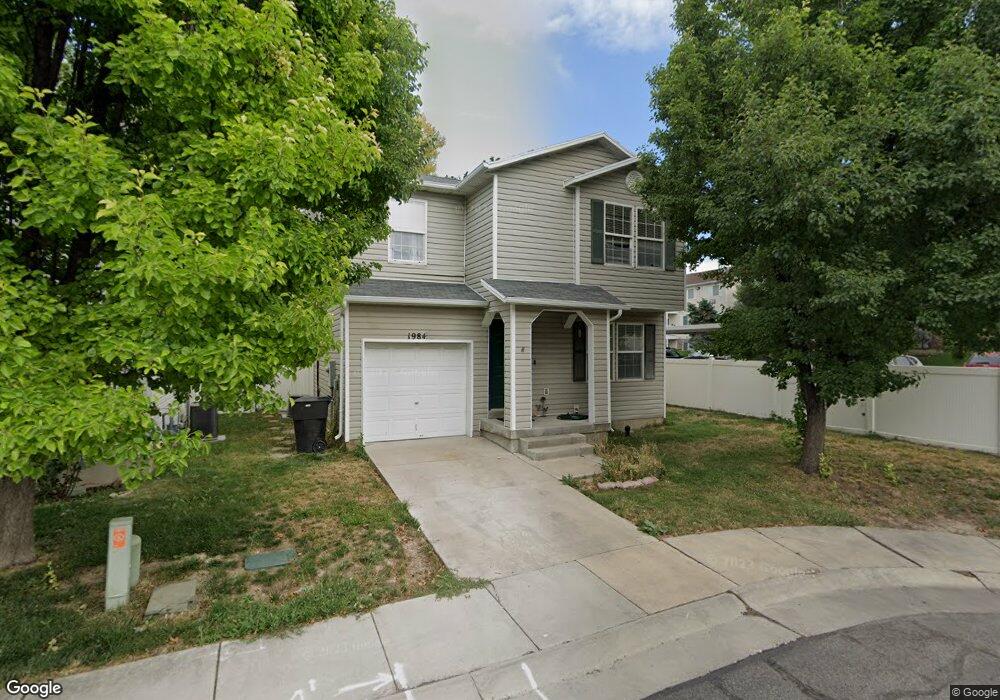
1984 N 2195 W Clearfield, UT 84015
Estimated Value: $346,000 - $373,000
3
Beds
1
Bath
1,142
Sq Ft
$314/Sq Ft
Est. Value
About This Home
This home is located at 1984 N 2195 W, Clearfield, UT 84015 and is currently estimated at $358,232, approximately $313 per square foot. 1984 N 2195 W is a home located in Davis County with nearby schools including Parkside Elementary School, West Point Junior High School, and Clearfield High School.
Ownership History
Date
Name
Owned For
Owner Type
Purchase Details
Closed on
Sep 23, 2016
Sold by
Burrell Jordan B and Burrell Jasee J
Bought by
Young Kelly
Current Estimated Value
Purchase Details
Closed on
Aug 23, 2012
Sold by
Burrell Jasee J and Reinen Jasee J
Bought by
Burrell Jasee J and Burrell Jordan B
Home Financials for this Owner
Home Financials are based on the most recent Mortgage that was taken out on this home.
Original Mortgage
$128,353
Interest Rate
3.62%
Mortgage Type
FHA
Purchase Details
Closed on
Dec 23, 2008
Sold by
Marten Chad A
Bought by
Reinen Jasee J
Home Financials for this Owner
Home Financials are based on the most recent Mortgage that was taken out on this home.
Original Mortgage
$134,722
Interest Rate
6.03%
Mortgage Type
FHA
Purchase Details
Closed on
Feb 15, 2002
Sold by
Clinton Crossroads Llc
Bought by
Marten Chad A
Home Financials for this Owner
Home Financials are based on the most recent Mortgage that was taken out on this home.
Original Mortgage
$102,963
Interest Rate
7.13%
Mortgage Type
VA
Create a Home Valuation Report for This Property
The Home Valuation Report is an in-depth analysis detailing your home's value as well as a comparison with similar homes in the area
Home Values in the Area
Average Home Value in this Area
Purchase History
| Date | Buyer | Sale Price | Title Company |
|---|---|---|---|
| Young Kelly | -- | Vanguard Title | |
| Burrell Jasee J | -- | Accommodation | |
| Reinen Jasee J | -- | First American Title | |
| Marten Chad A | -- | First American Title Insuran |
Source: Public Records
Mortgage History
| Date | Status | Borrower | Loan Amount |
|---|---|---|---|
| Previous Owner | Burrell Jasee J | $128,353 | |
| Previous Owner | Reinen Jasee J | $134,722 | |
| Previous Owner | Marten Chad A | $102,963 |
Source: Public Records
Tax History
| Year | Tax Paid | Tax Assessment Tax Assessment Total Assessment is a certain percentage of the fair market value that is determined by local assessors to be the total taxable value of land and additions on the property. | Land | Improvement |
|---|---|---|---|---|
| 2025 | $1,705 | $163,900 | $58,639 | $105,261 |
| 2024 | $1,662 | $160,600 | $67,121 | $93,479 |
| 2023 | $1,526 | $273,000 | $71,748 | $201,252 |
| 2022 | $1,668 | $165,000 | $49,722 | $115,278 |
| 2021 | $1,519 | $223,000 | $52,588 | $170,412 |
| 2020 | $1,322 | $192,000 | $40,227 | $151,773 |
| 2019 | $1,283 | $182,000 | $55,538 | $126,462 |
| 2018 | $1,133 | $158,000 | $48,132 | $109,868 |
| 2016 | $0 | $70,180 | $18,570 | $51,610 |
| 2015 | $951 | $65,120 | $18,570 | $46,550 |
| 2014 | $883 | $61,399 | $18,570 | $42,829 |
| 2013 | -- | $64,093 | $20,163 | $43,930 |
Source: Public Records
Map
Nearby Homes
- 2616 N 2125 W Unit 147
- 1881 N 2350 W Unit 110
- 2259 W 1800 N
- 2329 W 1680 N
- 2434 W 2250 N
- 2219 N 2475 W
- 1631 N 2340 W
- 1521 N 2275 W
- 2544 W 1675 N
- 2611 W 1675 N Unit 17
- 1509 N 2475 W
- 2566 N 2125 W
- 2596 N 2125 W Unit 151
- 2596 N 2125 W
- 1727 N 2700 W
- 2602 N 2125 W
- 2602 N 2125 W Unit 150
- 2606 N 2125 W
- 2606 N 2125 W Unit 149
- 2593 N 2000 W
Your Personal Tour Guide
Ask me questions while you tour the home.