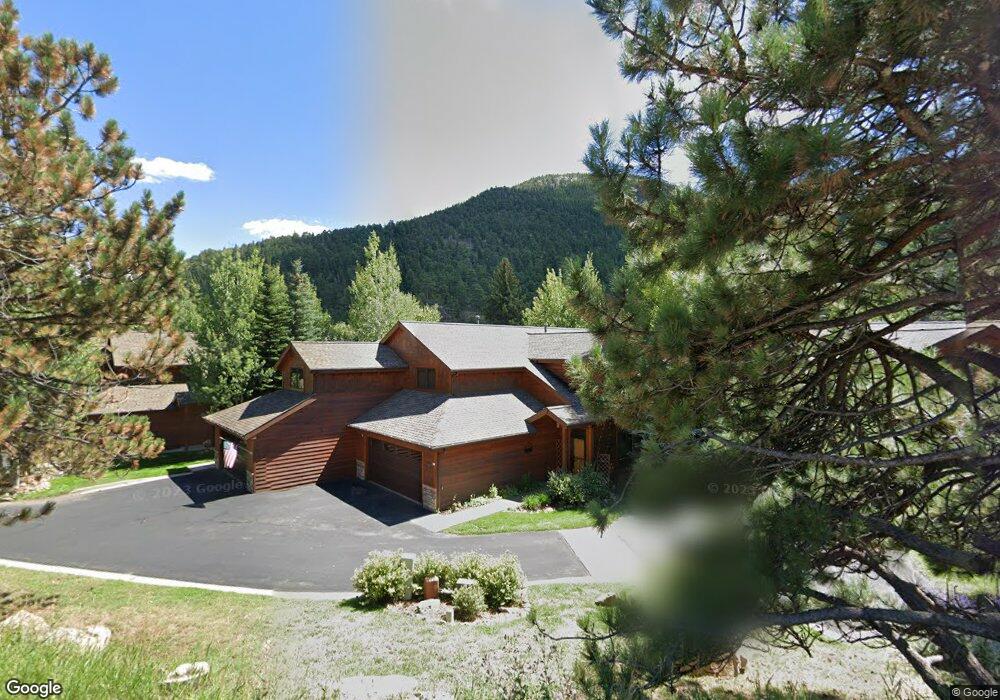
1986 Dallman Dr Unit 3 Estes Park, CO 80517
Estimated Value: $792,972 - $949,000
3
Beds
3
Baths
1,835
Sq Ft
$471/Sq Ft
Est. Value
About This Home
This home is located at 1986 Dallman Dr Unit 3, Estes Park, CO 80517 and is currently estimated at $864,243, approximately $470 per square foot. 1986 Dallman Dr Unit 3 is a home located in Larimer County with nearby schools including Estes Park K-5 School, Estes Park Options School, and Estes Park Middle School.
Ownership History
Date
Name
Owned For
Owner Type
Purchase Details
Closed on
Aug 13, 2009
Sold by
Hollenbeck Mark J
Bought by
Riverpeaks Llc
Current Estimated Value
Purchase Details
Closed on
Feb 16, 2007
Sold by
Dallman Bryce L and Dallman Lori A
Bought by
Hollenbeck Mark J
Home Financials for this Owner
Home Financials are based on the most recent Mortgage that was taken out on this home.
Original Mortgage
$82,350
Interest Rate
6.17%
Mortgage Type
Credit Line Revolving
Purchase Details
Closed on
Mar 18, 2005
Sold by
Bld Developers Llc
Bought by
Dallman Bryce L and Dallman Lori A
Home Financials for this Owner
Home Financials are based on the most recent Mortgage that was taken out on this home.
Original Mortgage
$260,000
Interest Rate
5.78%
Mortgage Type
Purchase Money Mortgage
Create a Home Valuation Report for This Property
The Home Valuation Report is an in-depth analysis detailing your home's value as well as a comparison with similar homes in the area
Home Values in the Area
Average Home Value in this Area
Purchase History
| Date | Buyer | Sale Price | Title Company |
|---|---|---|---|
| Riverpeaks Llc | $552,000 | None Available | |
| Hollenbeck Mark J | $549,000 | Commonwealth Title | |
| Dallman Bryce L | $419,000 | Security Title |
Source: Public Records
Mortgage History
| Date | Status | Borrower | Loan Amount |
|---|---|---|---|
| Previous Owner | Hollenbeck Mark J | $82,350 | |
| Previous Owner | Hollenbeck Mark J | $411,750 | |
| Previous Owner | Dallman Bryce L | $260,000 |
Source: Public Records
Tax History Compared to Growth
Tax History
| Year | Tax Paid | Tax Assessment Tax Assessment Total Assessment is a certain percentage of the fair market value that is determined by local assessors to be the total taxable value of land and additions on the property. | Land | Improvement |
|---|---|---|---|---|
| 2025 | $3,103 | $47,128 | $6,553 | $40,575 |
| 2024 | $3,068 | $47,128 | $6,553 | $40,575 |
| 2022 | $3,180 | $42,666 | $6,797 | $35,869 |
| 2021 | $3,265 | $43,894 | $6,993 | $36,901 |
| 2020 | $3,468 | $45,939 | $6,993 | $38,946 |
| 2019 | $3,443 | $45,939 | $6,993 | $38,946 |
| 2018 | $3,154 | $40,781 | $7,042 | $33,739 |
| 2017 | $3,171 | $40,781 | $7,042 | $33,739 |
| 2016 | $3,180 | $42,355 | $7,785 | $34,570 |
| 2015 | $3,140 | $42,350 | $7,780 | $34,570 |
| 2014 | $2,930 | $40,620 | $7,780 | $32,840 |
Source: Public Records
Map
Nearby Homes
- 2220 Eagle Cliff Rd
- 2238 Eagle Cliff Rd
- 2325 Highway 66
- 2450 Eagle Cliff Rd
- 1565 State Highway 66 Unit 33
- 1565 Highway 66 Unit 46
- 1565 Highway 66 Unit 49
- 1565 Highway 66 Unit 28
- 1611 High Dr
- 831 Larkspur Rd
- 739 Larkspur Rd
- 811 Larkspur Rd
- 725 Upper Larkspur Ln
- 1401 High Dr
- 810 Larkspur Rd
- 821 Windy Rose Dr
- 1252 Giant Track Rd
- 0 Alpaca Farm Way
- 1141 Wallace Ln
- 760 Meadow Cir
- 1986 Dallman Dr Unit 2
- 1986 Dallman Dr Unit 1
- 1986 Dallman Dr Unit 11
- 1986 Dallman Dr Unit 10
- 1986 Dallman Dr Unit 9
- 1986 Dallman Dr Unit 8
- 1986 Dallman Dr Unit 7
- 1986 Dallman Dr Unit 6
- 1986 Dallman Dr Unit 5
- 1986 Dallman Dr Unit 4
- 1986 Dallman Dr
- 1985 Highway 66
- 1985 State Highway 66
- 21021 Ava Chase Ln
- 1968 Eagle Cliff Rd
- 2024 Eagle Cliff Rd
- 0 Rippling River Dr Unit 4 653931
- 0 Rippling River Dr Unit 1 653928
- 0 Rippling River Dr Unit 4 677813
- 1862 State Highway 66