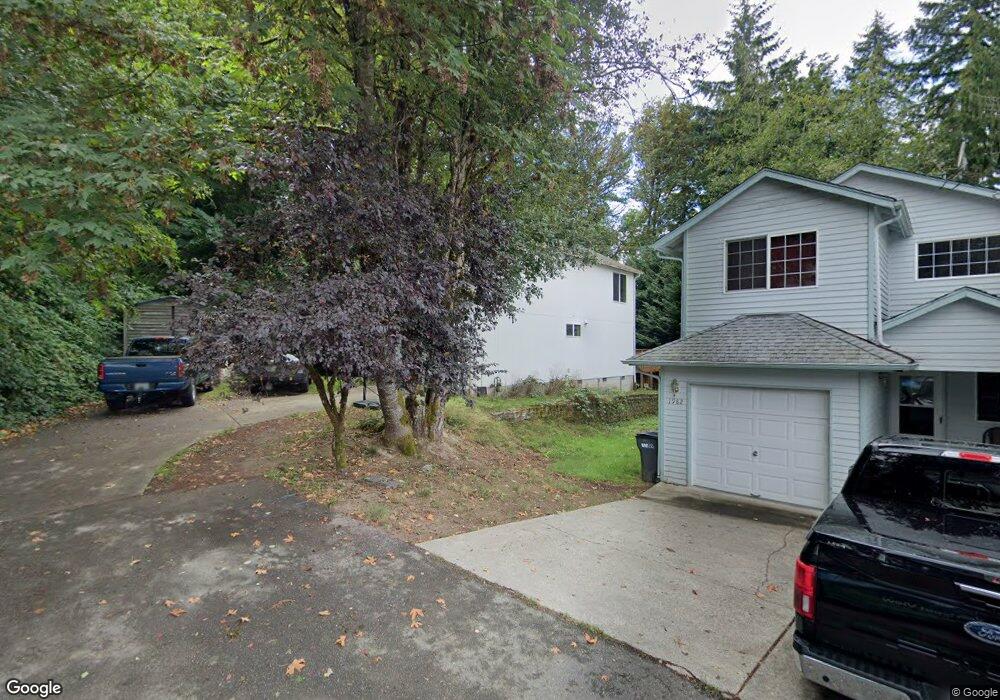
1986 Longview Ave Port Orchard, WA 98366
Estimated Value: $426,455 - $473,000
3
Beds
3
Baths
1,278
Sq Ft
$350/Sq Ft
Est. Value
About This Home
This home is located at 1986 Longview Ave, Port Orchard, WA 98366 and is currently estimated at $447,364, approximately $350 per square foot. 1986 Longview Ave is a home located in Kitsap County with nearby schools including Sidney Glen Elementary School, Cedar Heights Middle School, and South Kitsap High School.
Ownership History
Date
Name
Owned For
Owner Type
Purchase Details
Closed on
Oct 20, 2004
Sold by
Blue Cascade Construction Inc
Bought by
Hicks Martin R
Current Estimated Value
Home Financials for this Owner
Home Financials are based on the most recent Mortgage that was taken out on this home.
Original Mortgage
$190,700
Outstanding Balance
$94,761
Interest Rate
5.82%
Mortgage Type
VA
Estimated Equity
$352,603
Purchase Details
Closed on
Jun 21, 2004
Sold by
Childress Charles L and Childress Marguerite E
Bought by
Blue Cascade Construction Inc
Home Financials for this Owner
Home Financials are based on the most recent Mortgage that was taken out on this home.
Original Mortgage
$148,000
Interest Rate
6.29%
Mortgage Type
Construction
Purchase Details
Closed on
Jun 18, 2001
Sold by
James James T and James Carol J
Bought by
Childress Charles L and Childress Marguerite E
Create a Home Valuation Report for This Property
The Home Valuation Report is an in-depth analysis detailing your home's value as well as a comparison with similar homes in the area
Home Values in the Area
Average Home Value in this Area
Purchase History
| Date | Buyer | Sale Price | Title Company |
|---|---|---|---|
| Hicks Martin R | $190,700 | Transnation Title | |
| Blue Cascade Construction Inc | -- | Transnation Title | |
| Childress Charles L | -- | Transnation Title Insurance |
Source: Public Records
Mortgage History
| Date | Status | Borrower | Loan Amount |
|---|---|---|---|
| Open | Hicks Martin R | $190,700 | |
| Previous Owner | Blue Cascade Construction Inc | $148,000 |
Source: Public Records
Tax History Compared to Growth
Tax History
| Year | Tax Paid | Tax Assessment Tax Assessment Total Assessment is a certain percentage of the fair market value that is determined by local assessors to be the total taxable value of land and additions on the property. | Land | Improvement |
|---|---|---|---|---|
| 2026 | $2,938 | $349,080 | $71,820 | $277,260 |
| 2025 | $2,938 | $336,600 | $60,420 | $276,180 |
| 2024 | $2,836 | $336,600 | $60,420 | $276,180 |
| 2023 | $2,833 | $336,600 | $60,420 | $276,180 |
| 2022 | $2,773 | $277,360 | $56,420 | $220,940 |
| 2021 | $2,419 | $229,280 | $52,430 | $176,850 |
| 2020 | $2,380 | $218,750 | $49,930 | $168,820 |
| 2019 | $1,951 | $196,290 | $51,600 | $144,690 |
| 2018 | $2,064 | $161,710 | $51,600 | $110,110 |
| 2017 | $1,773 | $161,710 | $51,600 | $110,110 |
| 2016 | $1,732 | $146,240 | $51,600 | $94,640 |
| 2015 | $1,672 | $143,510 | $51,600 | $91,910 |
| 2014 | -- | $141,690 | $51,600 | $90,090 |
| 2013 | -- | $153,600 | $54,320 | $99,280 |
Source: Public Records
Map
Nearby Homes
- 1994 Advantage Ave
- 397 Donna St
- 252 Sage St
- 155 May St W
- 122 Fireweed St
- 512 SW Berry Lake Rd Unit 24
- 512 SW Berry Lake Rd Unit 26
- 512 SW Berry Lake Rd Unit 15
- 1566 SW Old Clifton Rd
- 280 Flower Meadows St
- 1369 Sherman Ave
- 4595 Weyers Ln SW
- 200 Leora Park St
- 1408 West Ave
- 1930 Emerald Hills Ln
- 1325 Garrison Ave
- 1234 Garrison Ave
- 912 Eagle Crest Place
- 2561 Anderson Hill Rd SW
- 4207 Nettle Dr SE
- 1982 Longview Ave
- 1982 Longview Ave
- 1986 Snowridge Ave
- 1980 Longview Ave
- 1988 Snowridge Ave
- 1984 Snowridge Ave
- 500 Ross St
- 1990 Snowridge Ave
- 1976 Longview Ave
- 1987 Snowridge Ave
- 503 Ross St
- 1983 Snowridge Ave
- 1995 Snowridge Ave
- 1981 Snowridge Ave
- 1980 Snowridge Ave
- 1994 Snowridge Ave
- 1970 Longview Ave
- 1979 Snowridge Ave
- 1996 Advantage Ave
- 1996 Snowridge Ave