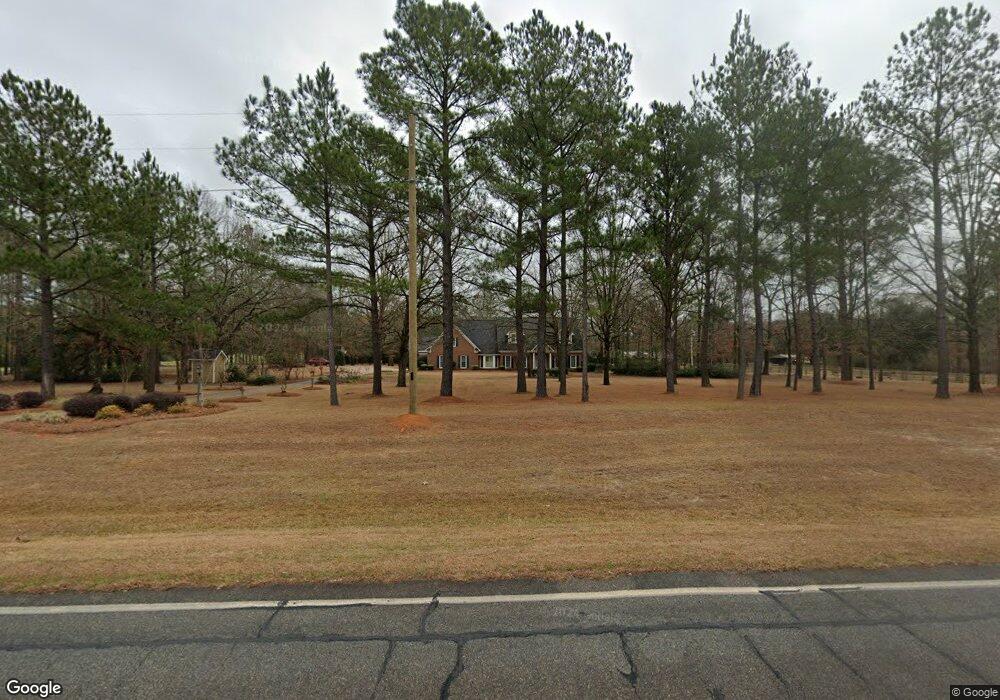
19860 Ga Highway 39 Blakely, GA 39823
Estimated Value: $388,000 - $644,000
--
Bed
1
Bath
3,605
Sq Ft
$140/Sq Ft
Est. Value
About This Home
This home is located at 19860 Ga Highway 39, Blakely, GA 39823 and is currently estimated at $504,215, approximately $139 per square foot. 19860 Ga Highway 39 is a home located in Early County with nearby schools including Early County Elementary School, Early County Middle School, and Early County High School.
Ownership History
Date
Name
Owned For
Owner Type
Purchase Details
Closed on
Sep 1, 2023
Sold by
Last Will
Bought by
Mcdaniel Hart Marie
Current Estimated Value
Purchase Details
Closed on
May 18, 2016
Sold by
Hutchins Ronald E
Bought by
Bennett Garrett N and Bennett Dana G
Purchase Details
Closed on
Aug 30, 2007
Sold by
Howard Martin T
Bought by
Hutchins Ronald E and Hutchins Teresa J
Home Financials for this Owner
Home Financials are based on the most recent Mortgage that was taken out on this home.
Original Mortgage
$290,537
Interest Rate
6.62%
Mortgage Type
New Conventional
Purchase Details
Closed on
Feb 6, 1997
Sold by
Kramer Kevin John
Bought by
Howard Marty T and Howard Lis
Purchase Details
Closed on
Jul 15, 1991
Bought by
Kramer Kevin John
Create a Home Valuation Report for This Property
The Home Valuation Report is an in-depth analysis detailing your home's value as well as a comparison with similar homes in the area
Home Values in the Area
Average Home Value in this Area
Purchase History
| Date | Buyer | Sale Price | Title Company |
|---|---|---|---|
| Mcdaniel Hart Marie | -- | -- | |
| Bennett Garrett N | $300,000 | -- | |
| Hutchins Ronald E | $292,350 | -- | |
| Howard Marty T | $191,300 | -- | |
| Kramer Kevin John | $12,400 | -- |
Source: Public Records
Mortgage History
| Date | Status | Borrower | Loan Amount |
|---|---|---|---|
| Previous Owner | Hutchins Ronald E | $290,537 |
Source: Public Records
Tax History Compared to Growth
Tax History
| Year | Tax Paid | Tax Assessment Tax Assessment Total Assessment is a certain percentage of the fair market value that is determined by local assessors to be the total taxable value of land and additions on the property. | Land | Improvement |
|---|---|---|---|---|
| 2024 | $4,349 | $163,481 | $6,725 | $156,756 |
| 2023 | $3,868 | $163,481 | $6,725 | $156,756 |
| 2022 | $3,637 | $146,219 | $4,927 | $141,292 |
| 2021 | $3,275 | $130,616 | $4,927 | $125,689 |
| 2020 | $3,163 | $128,563 | $4,927 | $123,636 |
| 2019 | $3,196 | $126,233 | $4,927 | $121,306 |
| 2018 | $3,196 | $126,238 | $4,927 | $121,311 |
| 2017 | $3,286 | $127,629 | $4,927 | $122,702 |
| 2016 | $2,513 | $94,313 | $4,927 | $89,386 |
| 2015 | -- | $98,054 | $4,101 | $93,953 |
| 2014 | -- | $98,054 | $4,101 | $93,953 |
| 2013 | -- | $100,337 | $4,101 | $96,236 |
Source: Public Records
Map
Nearby Homes
- 216 Willow Glen Dr
- 203 Willow Glen Dr
- 21141 Lucile Rd
- 934 Southside Dr
- 7507 Old Lucile Rd
- 18802 E South Blvd
- 74 S Lancelot St
- 600 Chattahoochee Ave
- 00 Garden Dr
- 556 Flowers Dr
- 73 W Westward Ave
- 11401 Columbia St
- 76 S Jefferson Ave
- 23 Dothan Rd
- 73 Grove Place
- 234 College St
- 337 College St
- 000 Georgia 62
- Stein Rd
- 21 E Railroad Ln
- 19908 Ga Highway 39
- 19921 Ga Highway 39
- 10550 Three Notch Rd
- 19604 Ga Highway 39
- 130 Herbie Loop
- 10586 Three Notch Rd
- 20181 Ga Highway 39
- 98 Grier Rd
- 28 Herbie Loop
- 10182 Three Notch Rd
- 20235 Ga Highway 39
- 20267 Ga Highway 39
- 20304 Ga Highway 39
- 6148 Old Lucile Rd
- 6496 Old Lucile Rd
- 20342 Ga Highway 39
- 6500 Old Lucile Rd
- 314 Grier Rd
- 19268 Ga Highway 39
- 6392 Old Lucile Rd