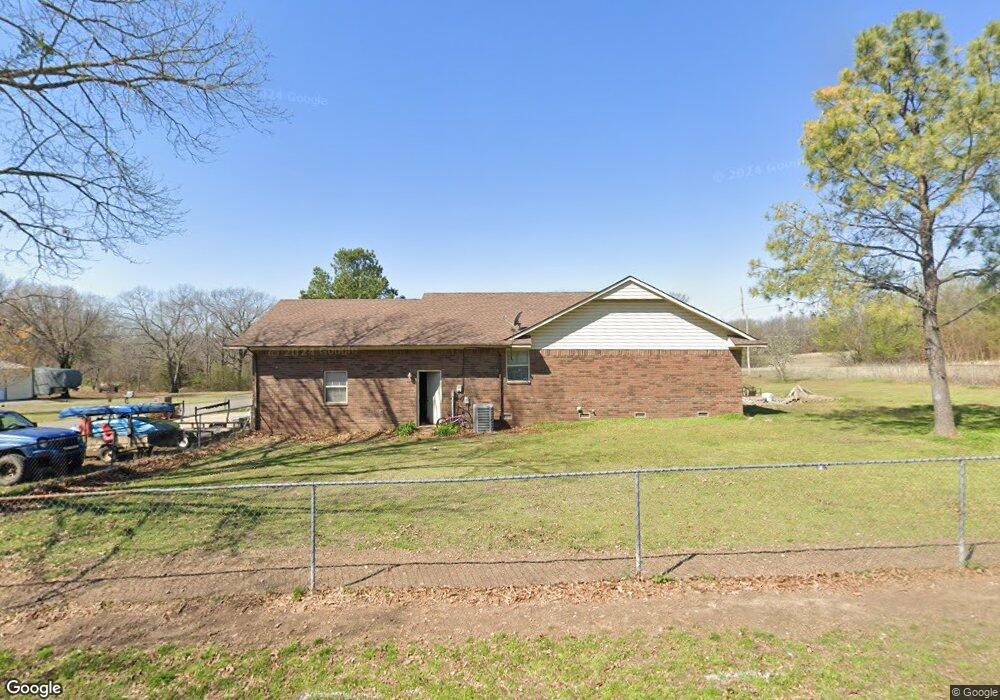
19862 E Canyon View Dr Tahlequah, OK 74464
Estimated Value: $201,000 - $227,000
3
Beds
2
Baths
1,356
Sq Ft
$159/Sq Ft
Est. Value
About This Home
This home is located at 19862 E Canyon View Dr, Tahlequah, OK 74464 and is currently estimated at $216,159, approximately $159 per square foot. 19862 E Canyon View Dr is a home located in Cherokee County with nearby schools including Greenwood Elementary School, Cherokee Elementary School, and Tahlequah Middle School.
Ownership History
Date
Name
Owned For
Owner Type
Purchase Details
Closed on
Oct 14, 2009
Sold by
Ware Dennis
Bought by
Hooper Whitney and Hooper Joey
Current Estimated Value
Home Financials for this Owner
Home Financials are based on the most recent Mortgage that was taken out on this home.
Original Mortgage
$108,050
Outstanding Balance
$70,340
Interest Rate
5.1%
Mortgage Type
FHA
Estimated Equity
$145,819
Purchase Details
Closed on
Mar 29, 2007
Sold by
Carter Forest O and Carter Euna F
Bought by
Ware Dennis
Home Financials for this Owner
Home Financials are based on the most recent Mortgage that was taken out on this home.
Original Mortgage
$102,111
Interest Rate
6.19%
Mortgage Type
FHA
Purchase Details
Closed on
Jun 8, 2004
Sold by
Betty Jo Liston
Bought by
Forest and Euna Carter
Create a Home Valuation Report for This Property
The Home Valuation Report is an in-depth analysis detailing your home's value as well as a comparison with similar homes in the area
Home Values in the Area
Average Home Value in this Area
Purchase History
| Date | Buyer | Sale Price | Title Company |
|---|---|---|---|
| Hooper Whitney | $113,500 | None Available | |
| Ware Dennis | $106,500 | Tahlequah Abstract Closing S | |
| Forest | $15,000 | -- |
Source: Public Records
Mortgage History
| Date | Status | Borrower | Loan Amount |
|---|---|---|---|
| Open | Hooper Whitney | $108,050 | |
| Previous Owner | Ware Dennis | $102,111 |
Source: Public Records
Tax History Compared to Growth
Tax History
| Year | Tax Paid | Tax Assessment Tax Assessment Total Assessment is a certain percentage of the fair market value that is determined by local assessors to be the total taxable value of land and additions on the property. | Land | Improvement |
|---|---|---|---|---|
| 2025 | $1,573 | $17,433 | $1,650 | $15,783 |
| 2024 | $1,573 | $16,602 | $1,650 | $14,952 |
| 2023 | $1,573 | $15,812 | $1,650 | $14,162 |
| 2022 | $1,467 | $15,812 | $1,650 | $14,162 |
| 2021 | $1,472 | $15,812 | $1,650 | $14,162 |
| 2020 | $1,499 | $15,812 | $1,650 | $14,162 |
| 2019 | $1,486 | $15,812 | $1,650 | $14,162 |
| 2018 | $1,442 | $15,166 | $1,650 | $13,516 |
| 2017 | $1,371 | $14,452 | $1,650 | $12,802 |
| 2016 | $1,314 | $13,764 | $1,650 | $12,114 |
| 2015 | $1,175 | $13,109 | $1,650 | $11,459 |
| 2014 | $1,175 | $12,485 | $1,650 | $10,835 |
Source: Public Records
Map
Nearby Homes
- 18714 S 525 Rd
- 18679 S 525 Rd
- 18781 S 526 Rd
- 725 Sooner Dr
- 0 S Hwy 82 A Hwy Unit 2532332
- 932 Rosemary
- 952 Edgewater
- 200 Remington Place
- 204 Woodhaven Ave
- 848 Crestview
- 835 Blue Heron
- 857 Crestview
- 103 S Harrison Ave
- 101 S Harrison Ave
- 1041 Edgewater
- 1005 Kaufman Ave
- 720 S East Ave
- 1065 Edgewater
- 1025 E Downing St
- 104 Tommye Ln
- 19862 E Canyon View Dr
- 18771 S 525 Rd
- 18735 S 525 Rd
- 18734 S 525 Rd
- 0 S 525 Rd Unit 1547998
- 0 S 525 Rd Unit 1547987
- 0 S 525 Rd Unit 1543988
- 0 S 525 Rd Unit 1543980
- 18721 S 525 Rd
- 18701 S 525 Rd
- 18794 S 525 Rd
- 19858 E 766 Rd
- 18704 S 525 Rd
- 19872 E 766 Rd
- 18594 S 524 Rd
- 18723 S 526 Rd
- 18765 S 526 Rd
- 19861 E 768 Rd
- 19861 E Canyon View Dr
- 19861 E Canyon View Dr