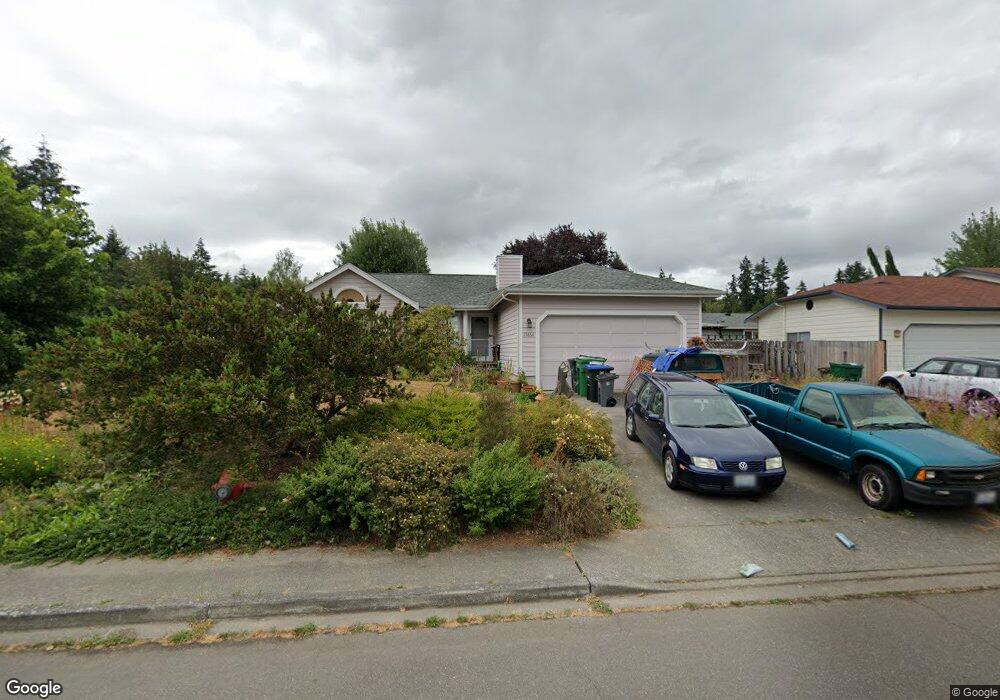
19864 Stavanger Loop NE Poulsbo, WA 98370
Estimated Value: $513,000 - $562,000
3
Beds
2
Baths
1,192
Sq Ft
$443/Sq Ft
Est. Value
About This Home
This home is located at 19864 Stavanger Loop NE, Poulsbo, WA 98370 and is currently estimated at $528,185, approximately $443 per square foot. 19864 Stavanger Loop NE is a home located in Kitsap County with nearby schools including Poulsbo Elementary School, Poulsbo Middle School, and North Kitsap High School.
Ownership History
Date
Name
Owned For
Owner Type
Purchase Details
Closed on
Jul 5, 2006
Sold by
Tolbert Shirley M
Bought by
Buckel Julie A
Current Estimated Value
Home Financials for this Owner
Home Financials are based on the most recent Mortgage that was taken out on this home.
Original Mortgage
$43,150
Interest Rate
6.66%
Mortgage Type
Stand Alone Second
Purchase Details
Closed on
Dec 24, 1997
Sold by
Myers Renee and Peterson Renee
Bought by
Tolbert Shirley M
Home Financials for this Owner
Home Financials are based on the most recent Mortgage that was taken out on this home.
Original Mortgage
$55,000
Interest Rate
7.16%
Create a Home Valuation Report for This Property
The Home Valuation Report is an in-depth analysis detailing your home's value as well as a comparison with similar homes in the area
Home Values in the Area
Average Home Value in this Area
Purchase History
| Date | Buyer | Sale Price | Title Company |
|---|---|---|---|
| Buckel Julie A | $288,180 | Transnation Title | |
| Tolbert Shirley M | $115,000 | Transnation Title Insurance |
Source: Public Records
Mortgage History
| Date | Status | Borrower | Loan Amount |
|---|---|---|---|
| Closed | Buckel Julie A | $43,150 | |
| Closed | Buckel Julie A | $230,300 | |
| Previous Owner | Tolbert Shirley M | $55,000 |
Source: Public Records
Tax History Compared to Growth
Tax History
| Year | Tax Paid | Tax Assessment Tax Assessment Total Assessment is a certain percentage of the fair market value that is determined by local assessors to be the total taxable value of land and additions on the property. | Land | Improvement |
|---|---|---|---|---|
| 2026 | $3,831 | $426,840 | $111,490 | $315,350 |
| 2025 | $3,831 | $426,840 | $111,490 | $315,350 |
| 2024 | $3,416 | $391,960 | $104,240 | $287,720 |
| 2023 | $3,475 | $391,960 | $104,240 | $287,720 |
| 2022 | $3,087 | $331,130 | $90,490 | $240,640 |
| 2021 | $2,987 | $296,870 | $81,080 | $215,790 |
| 2020 | $2,909 | $284,090 | $77,460 | $206,630 |
| 2019 | $2,724 | $265,940 | $72,390 | $193,550 |
| 2018 | $2,556 | $212,320 | $54,970 | $157,350 |
| 2017 | $2,441 | $212,320 | $54,970 | $157,350 |
| 2016 | $2,508 | $201,000 | $54,970 | $146,030 |
| 2015 | $2,432 | $195,860 | $54,970 | $140,890 |
| 2014 | -- | $188,660 | $54,970 | $133,690 |
| 2013 | -- | $188,660 | $54,970 | $133,690 |
Source: Public Records
Map
Nearby Homes
- 1330 NE Watland St
- 1257 Cameo Ct NE
- 20165 Bue Rund Loop NE
- 1343 Lena Place NE
- 1711 NE Outlook Way
- 19370 NE Larson Ct
- 1754 NE Mesford Rd Unit 12
- 1754 NE Mesford Rd Unit 28
- 20249 State Highway 305 NE
- 20248 Pugh Rd NE
- 20050 Vikings Crest Loop NE Unit 2-301
- 20274 Pugh Rd NE
- 20145 Vikings Crest Loop NE Unit 3-204
- 2416 NE Dynasty Dr
- 600 NE Lincoln Rd Unit 41
- 2496 NE Ariel Ct
- 19795 4th Ave NE
- 0 7th Ave NE Unit NWM2280996
- 18664 11th Ave NE
- 456 Little Valley Rd NE
- 19863 Mosjon Cir NE
- 19844 Stavanger Loop NE
- 19843 Mosjon Cir NE
- 19855 Stavanger Loop NE
- 19885 Stavanger Loop NE
- 19914 Stavanger Loop NE
- 19913 Mosjon Cir NE
- 19913 Stavanger Loop NE
- 19814 Stavanger Loop NE
- 19835 Stavanger Loop NE
- 19915 Stavanger Place NE
- 19813 Mosjon Cir NE
- 19862 Mosjon Cir NE
- 19934 Stavanger Place NE
- 19923 Mosjon Cir NE
- 19878 12th Ave NE
- 19935 Stavanger Place NE
- 19805 Stavanger Loop NE
- 19866 12th Ave NE
- 19784 Stavanger Loop NE