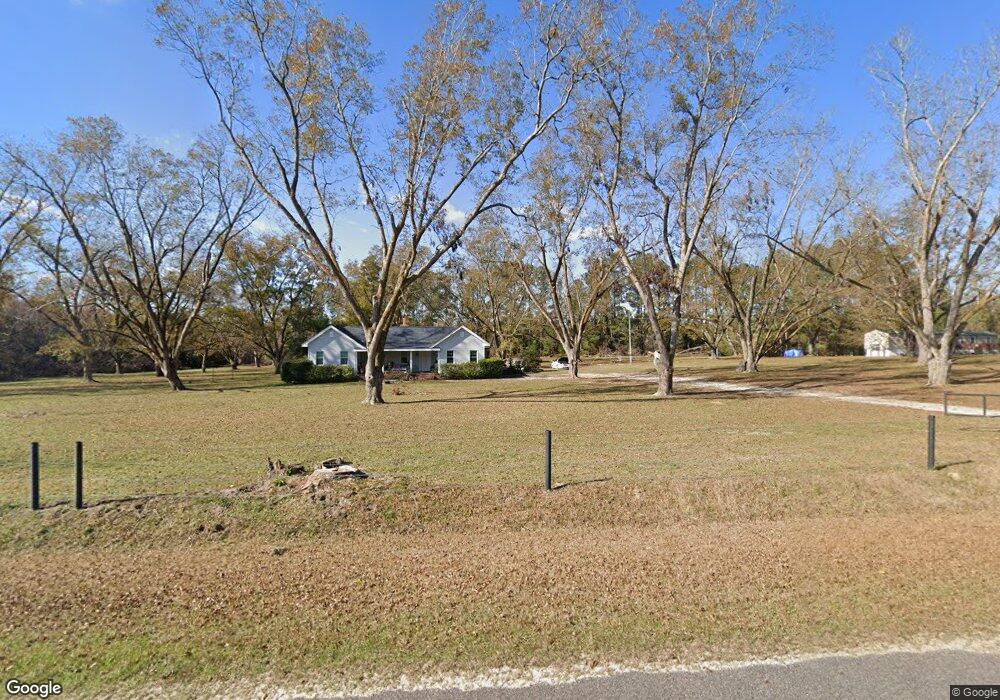
1987 Bay Branch Rd Sylvania, GA 30467
Estimated Value: $226,000 - $379,000
3
Beds
2
Baths
2,872
Sq Ft
$97/Sq Ft
Est. Value
About This Home
This home is located at 1987 Bay Branch Rd, Sylvania, GA 30467 and is currently estimated at $279,469, approximately $97 per square foot. 1987 Bay Branch Rd is a home located in Screven County with nearby schools including Screven County Elementary School, Screven County Middle School, and Screven County High School.
Ownership History
Date
Name
Owned For
Owner Type
Purchase Details
Closed on
Mar 29, 2018
Sold by
Barber Victoria
Bought by
Smith Bobby Lee
Current Estimated Value
Home Financials for this Owner
Home Financials are based on the most recent Mortgage that was taken out on this home.
Original Mortgage
$121,212
Outstanding Balance
$104,216
Interest Rate
4.43%
Mortgage Type
New Conventional
Estimated Equity
$175,253
Purchase Details
Closed on
Apr 4, 2016
Sold by
Barber Victoria G
Bought by
Wammock Gary A
Home Financials for this Owner
Home Financials are based on the most recent Mortgage that was taken out on this home.
Original Mortgage
$588,850
Interest Rate
3.64%
Mortgage Type
New Conventional
Purchase Details
Closed on
Sep 2, 1998
Sold by
Farmer Curtis and Farmer Vivian
Bought by
Toy Victoria G
Create a Home Valuation Report for This Property
The Home Valuation Report is an in-depth analysis detailing your home's value as well as a comparison with similar homes in the area
Home Values in the Area
Average Home Value in this Area
Purchase History
| Date | Buyer | Sale Price | Title Company |
|---|---|---|---|
| Smith Bobby Lee | $120,000 | -- | |
| Wammock Gary A | $727,660 | -- | |
| Toy Victoria G | -- | -- |
Source: Public Records
Mortgage History
| Date | Status | Borrower | Loan Amount |
|---|---|---|---|
| Open | Smith Bobby Lee | $121,212 | |
| Previous Owner | Wammock Gary A | $588,850 |
Source: Public Records
Tax History Compared to Growth
Tax History
| Year | Tax Paid | Tax Assessment Tax Assessment Total Assessment is a certain percentage of the fair market value that is determined by local assessors to be the total taxable value of land and additions on the property. | Land | Improvement |
|---|---|---|---|---|
| 2024 | $2,076 | $67,555 | $9,880 | $57,675 |
| 2023 | $2,088 | $66,096 | $9,880 | $56,216 |
| 2022 | $1,691 | $57,240 | $9,400 | $47,840 |
| 2021 | $1,626 | $52,480 | $9,400 | $43,080 |
| 2020 | $1,589 | $49,680 | $8,960 | $40,720 |
| 2019 | $1,597 | $50,320 | $8,960 | $41,360 |
| 2018 | $1,050 | $36,680 | $8,080 | $28,600 |
| 2017 | $1,050 | $36,680 | $8,080 | $28,600 |
| 2016 | $3,103 | $191,648 | $160,840 | $30,808 |
| 2015 | -- | $156,288 | $126,520 | $29,768 |
| 2014 | -- | $162,448 | $132,840 | $29,608 |
| 2013 | -- | $162,408 | $132,280 | $30,128 |
Source: Public Records
Map
Nearby Homes
- 4273 Millen Hwy
- 0 Indian Trail Rd Unit SA336880
- 0 Indian Trail Rd Unit 10614363
- 5303 Buttermilk Rd
- 319 Winchester Rd
- 0 Tram Rd
- 3552 Buttermilk Rd
- 613 Rocky Knob Rd
- 0 Dickey Rd
- 0 Rocky Knob Rd Unit 22483768
- 0 Rocky Knob Rd Unit 10527508
- 731 Deer Run Rd
- 1277 Millen Hiltonia Rd
- 201 Waters Grove Rd
- 1296 Millen Hwy
- 1000 Millen Hiltonia Rd
- 1066 Millen Hiltonia Rd
- 711 Scrub Oak Rd
- 0 Bethel Rd Unit TRACT 8 10425061
- 0 Bethel Rd Unit 22099565