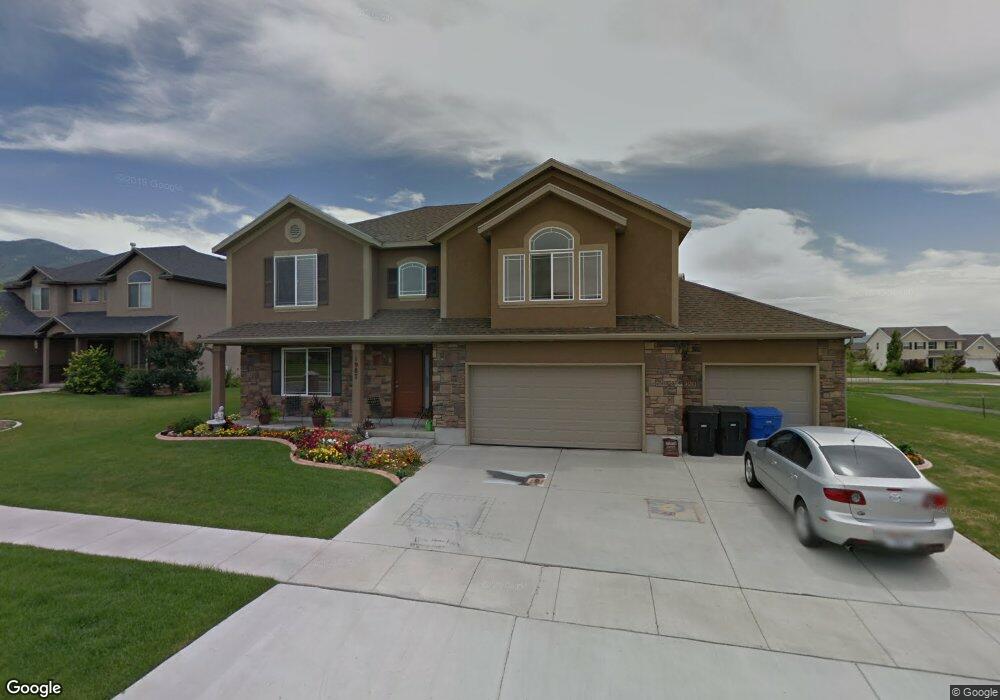
1987 Lonestar Dr Unit 532 Farmington, UT 84025
Estimated Value: $690,000 - $776,000
4
Beds
3
Baths
2,544
Sq Ft
$287/Sq Ft
Est. Value
About This Home
This home is located at 1987 Lonestar Dr Unit 532, Farmington, UT 84025 and is currently estimated at $728,995, approximately $286 per square foot. 1987 Lonestar Dr Unit 532 is a home located in Davis County with nearby schools including Eagle Bay Elementary School, Farmington High, and Farmington Junior High School.
Ownership History
Date
Name
Owned For
Owner Type
Purchase Details
Closed on
May 4, 2007
Sold by
Joel Hale Construction
Bought by
Tumia Vicki J
Current Estimated Value
Home Financials for this Owner
Home Financials are based on the most recent Mortgage that was taken out on this home.
Original Mortgage
$280,000
Outstanding Balance
$170,225
Interest Rate
6.25%
Mortgage Type
New Conventional
Estimated Equity
$558,770
Purchase Details
Closed on
Nov 29, 2006
Sold by
Sand Bay Llc
Bought by
Joel Hale Construction
Purchase Details
Closed on
Oct 17, 2006
Sold by
Lundberg Scott
Bought by
Sand Bay Llc
Purchase Details
Closed on
Aug 1, 2005
Sold by
Boyer Wheeler Farm Lc
Bought by
Real Estate Investor Network Llc
Home Financials for this Owner
Home Financials are based on the most recent Mortgage that was taken out on this home.
Original Mortgage
$72,960
Interest Rate
5.48%
Mortgage Type
Purchase Money Mortgage
Create a Home Valuation Report for This Property
The Home Valuation Report is an in-depth analysis detailing your home's value as well as a comparison with similar homes in the area
Home Values in the Area
Average Home Value in this Area
Purchase History
| Date | Buyer | Sale Price | Title Company |
|---|---|---|---|
| Tumia Vicki J | -- | Aspen Title Insurance Agency | |
| Joel Hale Construction | -- | Equity Title Ins Agency Inc | |
| Sand Bay Llc | $108,397 | None Available | |
| Real Estate Investor Network Llc | -- | First American Title |
Source: Public Records
Mortgage History
| Date | Status | Borrower | Loan Amount |
|---|---|---|---|
| Open | Tumia Vicki J | $280,000 | |
| Previous Owner | Real Estate Investor Network Llc | $72,960 |
Source: Public Records
Tax History Compared to Growth
Tax History
| Year | Tax Paid | Tax Assessment Tax Assessment Total Assessment is a certain percentage of the fair market value that is determined by local assessors to be the total taxable value of land and additions on the property. | Land | Improvement |
|---|---|---|---|---|
| 2025 | $3,663 | $341,550 | $175,050 | $166,500 |
| 2024 | $3,511 | $332,200 | $148,310 | $183,890 |
| 2023 | $3,430 | $595,000 | $241,286 | $353,714 |
| 2022 | $3,365 | $330,000 | $133,086 | $196,914 |
| 2021 | $3,038 | $442,000 | $135,104 | $306,896 |
| 2020 | $2,767 | $392,000 | $130,814 | $261,186 |
| 2019 | $2,766 | $383,000 | $151,943 | $231,057 |
| 2018 | $2,543 | $347,000 | $134,471 | $212,529 |
| 2016 | $2,439 | $175,395 | $50,889 | $124,506 |
| 2015 | $2,454 | $167,695 | $50,889 | $116,806 |
| 2014 | $2,308 | $161,842 | $44,740 | $117,102 |
| 2013 | -- | $155,825 | $29,438 | $126,387 |
Source: Public Records
Map
Nearby Homes
- 556 Innovator Dr Unit 158
- 1843 W Burke Ln Unit 103
- 234 N Dexter Cir
- 2081 Colt Dr
- Harvard Plan at Eastridge Estates
- Fortissimo Plan at Eastridge Estates
- Crescendo Plan at Eastridge Estates
- Browning Plan at Eastridge Estates
- Adagio Plan at Eastridge Estates
- Harrison Plan at Eastridge Estates
- Timpani Plan at Eastridge Estates
- Ballad Plan at Eastridge Estates
- Anthem Plan at Eastridge Estates
- Bravo Plan at Eastridge Estates
- Canon Plan at Eastridge Estates
- Treble Plan at Eastridge Estates
- Madrigal Plan at Eastridge Estates
- Trio Plan at Eastridge Estates
- Tempo Plan at Eastridge Estates
- Tenor Plan at Eastridge Estates
- 1987 Lonestar Dr
- 1976 Old Fort Rd
- 1976 Old Fort Rd Unit 531
- 1971 Lonestar Dr
- 1962 Old Fort Rd
- 1962 W Old Fort Rd
- 1994 Lonestar Dr
- 2009 Lonestar Dr
- 1959 Lonestar Dr
- 1959 W Lonestar Dr
- 1986 W Lonestar Dr
- 1998 W Old Fort Rd
- 1998 W Old Fort Rd Unit 459
- 1986 Lonestar Dr
- 1998 Old Fort Rd
- 2024 W Lonestar Dr
- 1948 Old Fort Rd
- 2024 Lonestar Dr
- 2027 Lonestar Dr
- 2011 Stampede Dr