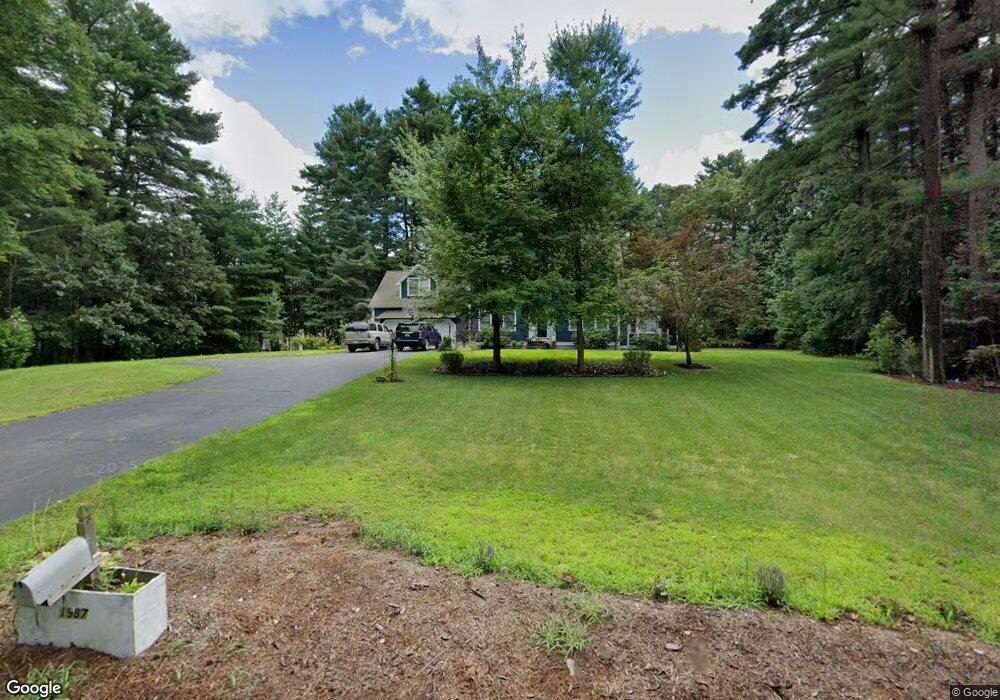
1987 West St Wrentham, MA 02093
West Wrentham NeighborhoodEstimated Value: $834,000 - $972,000
5
Beds
3
Baths
2,634
Sq Ft
$343/Sq Ft
Est. Value
About This Home
This home is located at 1987 West St, Wrentham, MA 02093 and is currently estimated at $903,945, approximately $343 per square foot. 1987 West St is a home located in Norfolk County with nearby schools including Delaney Elementary School, Charles E Roderick, and Mercymount Country Day School.
Ownership History
Date
Name
Owned For
Owner Type
Purchase Details
Closed on
Jul 31, 1998
Sold by
Ofena Corp
Bought by
Mclaughlin Dennis A
Current Estimated Value
Home Financials for this Owner
Home Financials are based on the most recent Mortgage that was taken out on this home.
Original Mortgage
$217,500
Interest Rate
6.92%
Mortgage Type
Purchase Money Mortgage
Purchase Details
Closed on
Dec 7, 1995
Sold by
Pozzi Irene J
Bought by
Ofena Corp
Home Financials for this Owner
Home Financials are based on the most recent Mortgage that was taken out on this home.
Original Mortgage
$205,500
Interest Rate
7.44%
Mortgage Type
Purchase Money Mortgage
Create a Home Valuation Report for This Property
The Home Valuation Report is an in-depth analysis detailing your home's value as well as a comparison with similar homes in the area
Home Values in the Area
Average Home Value in this Area
Purchase History
| Date | Buyer | Sale Price | Title Company |
|---|---|---|---|
| Mclaughlin Dennis A | $297,241 | -- | |
| Ofena Corp | $160,000 | -- |
Source: Public Records
Mortgage History
| Date | Status | Borrower | Loan Amount |
|---|---|---|---|
| Open | Ofena Corp | $275,000 | |
| Closed | Ofena Corp | $217,500 | |
| Previous Owner | Ofena Corp | $205,500 | |
| Closed | Ofena Corp | $72,500 | |
| Closed | Ofena Corp | $43,500 |
Source: Public Records
Tax History Compared to Growth
Tax History
| Year | Tax Paid | Tax Assessment Tax Assessment Total Assessment is a certain percentage of the fair market value that is determined by local assessors to be the total taxable value of land and additions on the property. | Land | Improvement |
|---|---|---|---|---|
| 2025 | $8,941 | $771,400 | $290,500 | $480,900 |
| 2024 | $8,539 | $711,600 | $290,500 | $421,100 |
| 2023 | $8,452 | $669,700 | $264,400 | $405,300 |
| 2022 | $8,190 | $599,100 | $257,600 | $341,500 |
| 2021 | $7,810 | $555,100 | $240,900 | $314,200 |
| 2020 | $7,562 | $530,700 | $184,500 | $346,200 |
| 2019 | $7,013 | $496,700 | $166,300 | $330,400 |
| 2018 | $6,867 | $482,200 | $166,200 | $316,000 |
| 2017 | $6,726 | $472,000 | $163,000 | $309,000 |
| 2016 | $6,586 | $461,200 | $158,200 | $303,000 |
| 2015 | $6,856 | $457,700 | $168,800 | $288,900 |
| 2014 | $6,790 | $443,500 | $162,300 | $281,200 |
Source: Public Records
Map
Nearby Homes
- 50 Wamsutta Way
- 2095 West St
- 236 Williams St
- 60 Grant Ave
- 50 Heather Ln
- 25 Nature View Dr
- 851 Washington St
- 17 Stanford Rd
- 20 Nature View Dr
- 39 Sumner Brown Rd
- 10 Stanford Rd
- 180 Pine Swamp Rd
- 56 Pine Swamp Rd
- 2 Duhamel Way
- 9 Pebble Cir Unit 9
- 584 Washington St
- 65 Palmetto Dr Unit 65
- 21 Palmetto Dr Unit 21
- 24 Palmetto Dr Unit 24
- 8 Bubbling Brook Rd