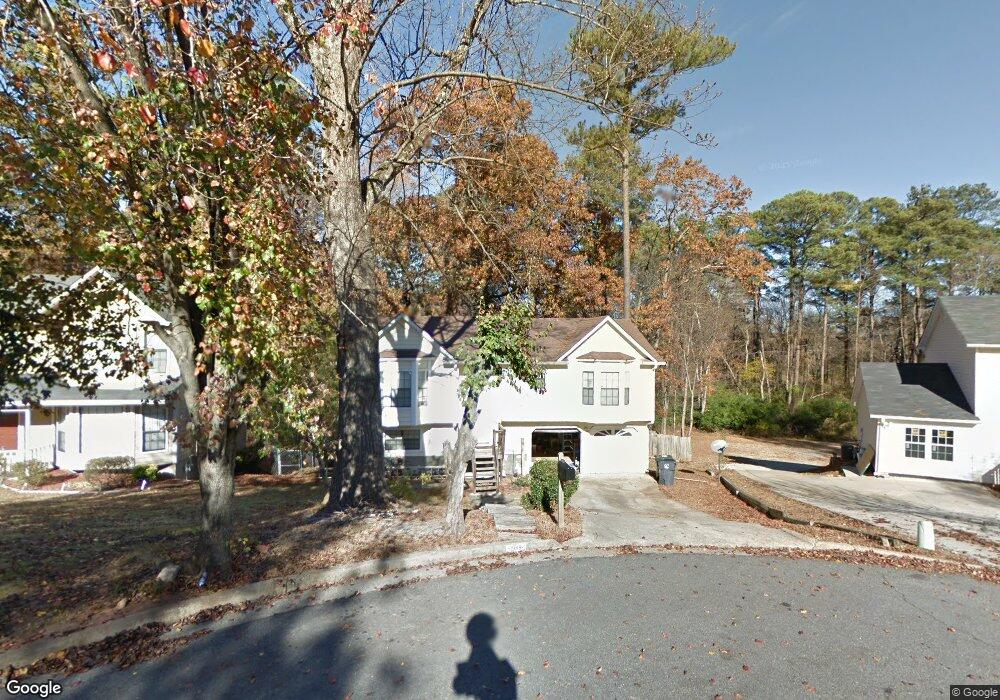
1989 Hoot Owl Trail Unit 3 Norcross, GA 30071
Estimated Value: $324,583 - $377,000
3
Beds
2
Baths
1,320
Sq Ft
$270/Sq Ft
Est. Value
About This Home
This home is located at 1989 Hoot Owl Trail Unit 3, Norcross, GA 30071 and is currently estimated at $356,896, approximately $270 per square foot. 1989 Hoot Owl Trail Unit 3 is a home located in Gwinnett County with nearby schools including Beaver Ridge Elementary School, Summerour Middle School, and Paul Duke STEM High School.
Ownership History
Date
Name
Owned For
Owner Type
Purchase Details
Closed on
Nov 22, 2000
Sold by
Delgado Felipe
Bought by
Delgado Felipe and Delgado Yeni
Current Estimated Value
Home Financials for this Owner
Home Financials are based on the most recent Mortgage that was taken out on this home.
Original Mortgage
$138,900
Outstanding Balance
$50,963
Interest Rate
7.82%
Mortgage Type
FHA
Estimated Equity
$305,933
Purchase Details
Closed on
Jun 9, 1995
Sold by
Paulson Jeffrey W
Bought by
Ray Joellen C
Purchase Details
Closed on
Sep 10, 1993
Sold by
Jackson Donna L
Bought by
Paulson Jeffrey
Home Financials for this Owner
Home Financials are based on the most recent Mortgage that was taken out on this home.
Original Mortgage
$84,750
Interest Rate
7.19%
Mortgage Type
FHA
Create a Home Valuation Report for This Property
The Home Valuation Report is an in-depth analysis detailing your home's value as well as a comparison with similar homes in the area
Home Values in the Area
Average Home Value in this Area
Purchase History
| Date | Buyer | Sale Price | Title Company |
|---|---|---|---|
| Delgado Felipe | -- | -- | |
| Delgado Felipe | $139,000 | -- | |
| Ray Joellen C | $12,000 | -- | |
| Paulson Jeffrey | $12,500 | -- |
Source: Public Records
Mortgage History
| Date | Status | Borrower | Loan Amount |
|---|---|---|---|
| Open | Delgado Felipe | $138,900 | |
| Previous Owner | Paulson Jeffrey | $84,750 | |
| Closed | Paulson Jeffrey | $8,000 | |
| Closed | Ray Joellen C | $0 |
Source: Public Records
Tax History Compared to Growth
Tax History
| Year | Tax Paid | Tax Assessment Tax Assessment Total Assessment is a certain percentage of the fair market value that is determined by local assessors to be the total taxable value of land and additions on the property. | Land | Improvement |
|---|---|---|---|---|
| 2024 | $4,389 | $137,160 | $22,400 | $114,760 |
| 2023 | $4,389 | $137,160 | $22,400 | $114,760 |
| 2022 | $3,911 | $121,840 | $22,400 | $99,440 |
| 2021 | $2,561 | $78,080 | $13,600 | $64,480 |
| 2020 | $2,581 | $78,080 | $13,600 | $64,480 |
| 2019 | $2,614 | $60,080 | $10,800 | $49,280 |
| 2018 | $1,989 | $60,080 | $10,800 | $49,280 |
| 2016 | $1,555 | $47,040 | $8,000 | $39,040 |
| 2015 | $1,614 | $36,000 | $6,000 | $30,000 |
| 2014 | $1,215 | $36,000 | $6,000 | $30,000 |
Source: Public Records
Map
Nearby Homes
- 2009 Hoot Owl Trail
- 2000 Ferentz Trace
- 5517 Rails Way
- 5512 Goodwick Way
- 5645 Hammond Dr
- 5375 Goshen Springs Rd
- 91 Brookway Trace
- 2199 Summertown Dr
- 5346 Pinnacle Peak Ln
- 603 Brighton Ct
- 101 Vineyard Pond Dr NW
- 2037 Pinnacle Pointe Dr
- 5772 Western Hills Dr
- 2375 Anamanda Close
- 5477 Windy Creek Ln
- 5479 Windy Creek Ln
- 1620 Cove Creek Cir Unit 304
- 5106 Rockborough Trail
- 1999 Hoot Owl Trail
- 1979 Hoot Owl Trail
- 2059 Pinnacle Walk
- 2059 Pinnacle Walk Unit ID1234820P
- 5227 Rails Way Unit 3
- 1969 Hoot Owl Trail
- 5237 Rails Way
- 1998 Hoot Owl Trail Unit 3
- 1978 Hoot Owl Trail
- 1988 Hoot Owl Trail Unit 3
- 2008 Hoot Owl Trail
- 5247 Rails Way
- 5216 Rails Way Unit 3
- 5257 Rails Way
- 5236 Rails Way
- 5187 Rails Way
- 5196 Rails Way
- 5256 Rails Way
- 5267 Rails Way
- 5186 Rails Way