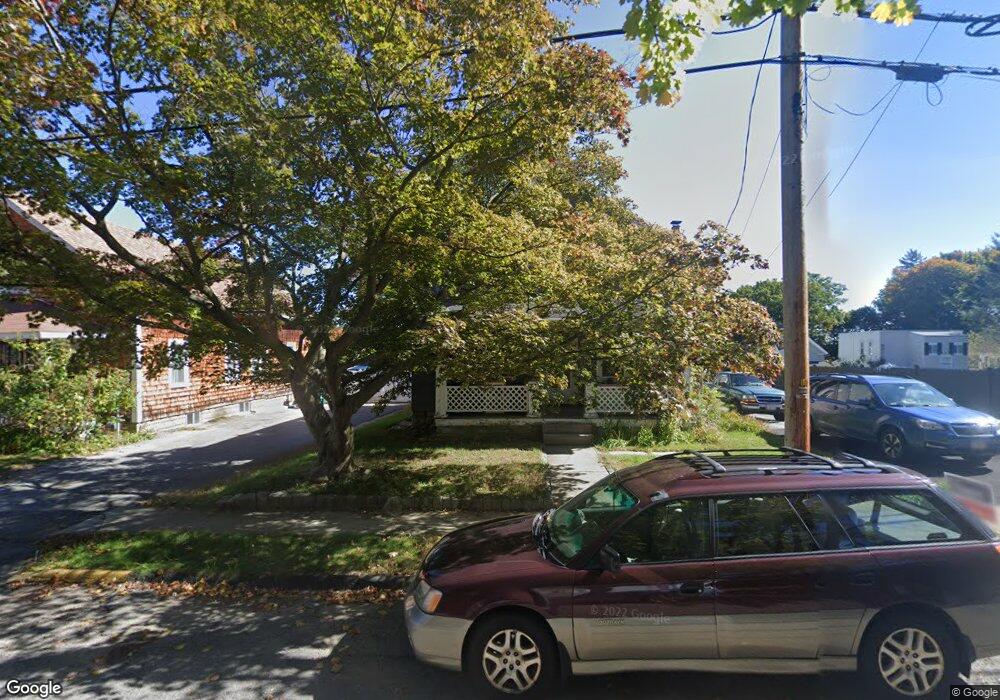
199 Cedar St Fitchburg, MA 01420
Estimated Value: $338,000 - $383,000
5
Beds
1
Bath
1,520
Sq Ft
$241/Sq Ft
Est. Value
About This Home
This home is located at 199 Cedar St, Fitchburg, MA 01420 and is currently estimated at $365,968, approximately $240 per square foot. 199 Cedar St is a home located in Worcester County with nearby schools including South Street Elementary School, Crocker Elementary School, and Fitchburg High School.
Ownership History
Date
Name
Owned For
Owner Type
Purchase Details
Closed on
Dec 28, 1999
Sold by
Department Of Housing & Urban Dev
Bought by
Latini Michael A and Latini Jennifer A
Current Estimated Value
Purchase Details
Closed on
May 7, 1999
Sold by
Kaufmann Glen J Est and Bank United
Bought by
Bank United
Purchase Details
Closed on
Jun 10, 1996
Sold by
Kaufmann Glen J and Kaufmann Donna M
Bought by
Ellis David M and Ellis Maribeth
Purchase Details
Closed on
Jan 9, 1995
Sold by
Fhlmc
Bought by
Kaufmann Glen J and Kaufmann Donna M
Purchase Details
Closed on
Sep 2, 1994
Sold by
Matthews Douglas J and Federal Home Loan Mortgage Corporation
Bought by
Fhlmc
Purchase Details
Closed on
Sep 30, 1987
Sold by
Merchant Douglas J
Bought by
Matthews Douglas J
Create a Home Valuation Report for This Property
The Home Valuation Report is an in-depth analysis detailing your home's value as well as a comparison with similar homes in the area
Home Values in the Area
Average Home Value in this Area
Purchase History
| Date | Buyer | Sale Price | Title Company |
|---|---|---|---|
| Latini Michael A | $80,000 | -- | |
| Bank United | $101,066 | -- | |
| Ellis David M | $79,728 | -- | |
| Kaufmann Glen J | $35,000 | -- | |
| Fhlmc | $64,600 | -- | |
| Matthews Douglas J | $89,900 | -- |
Source: Public Records
Mortgage History
| Date | Status | Borrower | Loan Amount |
|---|---|---|---|
| Open | Matthews Douglas J | $75,500 | |
| Closed | Matthews Douglas J | $32,870 |
Source: Public Records
Tax History Compared to Growth
Tax History
| Year | Tax Paid | Tax Assessment Tax Assessment Total Assessment is a certain percentage of the fair market value that is determined by local assessors to be the total taxable value of land and additions on the property. | Land | Improvement |
|---|---|---|---|---|
| 2025 | $43 | $317,100 | $97,300 | $219,800 |
| 2024 | $4,034 | $272,400 | $59,700 | $212,700 |
| 2023 | $3,987 | $248,900 | $51,400 | $197,500 |
| 2022 | $3,622 | $205,700 | $43,000 | $162,700 |
| 2021 | $2,398 | $175,200 | $31,100 | $144,100 |
| 2020 | $0 | $163,900 | $28,700 | $135,200 |
| 2019 | $5,612 | $153,000 | $40,600 | $112,400 |
| 2018 | $2,467 | $117,400 | $38,200 | $79,200 |
| 2017 | $2,353 | $109,500 | $38,200 | $71,300 |
| 2016 | $2,136 | $100,600 | $34,600 | $66,000 |
| 2015 | $2,116 | $102,300 | $33,400 | $68,900 |
| 2014 | $2,027 | $102,200 | $33,400 | $68,800 |
Source: Public Records
Map
Nearby Homes
- 855 John Fitch Hwy Unit 44
- 288-290 Pearl St
- 206 Highland Ave
- 137 East St
- 94 Fitch Hill Ave
- 56 Orange St
- 62 Wendell Rd
- 168 Lunenburg St
- 1 Avon Place
- 23 Marshall Rd
- 208 Blossom St
- 4 Brigham Park
- 0 Townsend St
- 29 Brigham Park
- 15-25 Lunenburg St
- 85 Boutelle St
- 34 Garnet St
- 5 Jay St
- 36 Jackson Ave
- 29 Mount Vernon St