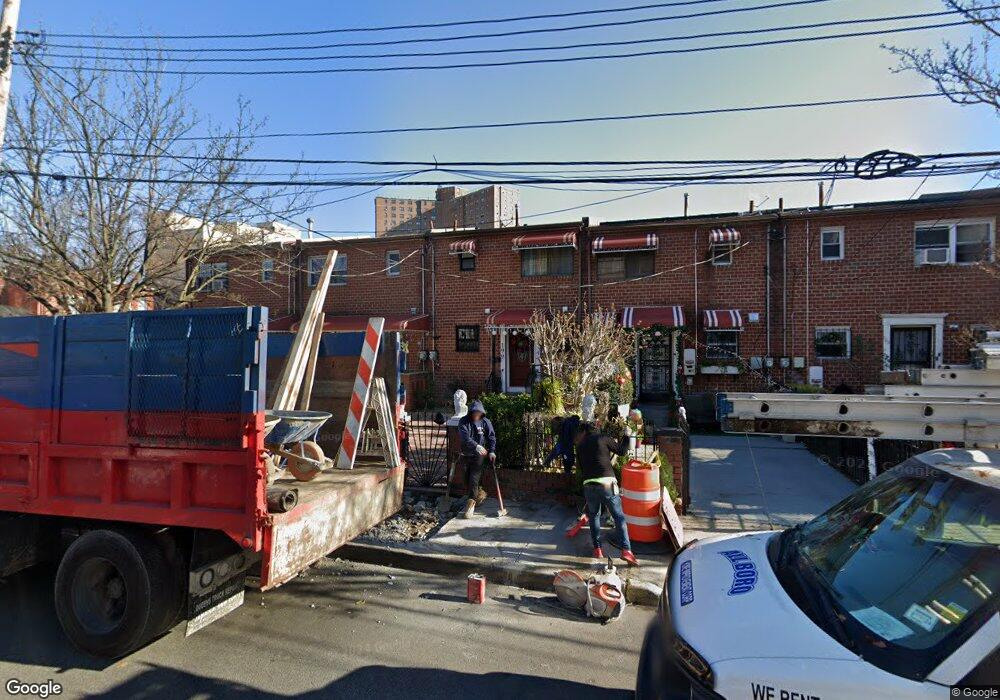
199 Chester St Brooklyn, NY 11212
Brownsville NeighborhoodEstimated Value: $589,885 - $867,000
3
Beds
2
Baths
1,148
Sq Ft
$588/Sq Ft
Est. Value
About This Home
This home is located at 199 Chester St, Brooklyn, NY 11212 and is currently estimated at $675,221, approximately $588 per square foot. 199 Chester St is a home located in Kings County with nearby schools including P.S. 156 Waverly, P.S. 150 - Christopher, and P.S. 165 Ida Posner.
Ownership History
Date
Name
Owned For
Owner Type
Purchase Details
Closed on
Feb 7, 2025
Sold by
Pilatasig Moposita Jaime R
Bought by
Pilatasig Moposita Jaime R and Ramos Teneda Alicia Graciela
Current Estimated Value
Purchase Details
Closed on
Mar 12, 2019
Sold by
New Hope & Beyond Inc
Bought by
Pilatasig Moposita Jaime R
Home Financials for this Owner
Home Financials are based on the most recent Mortgage that was taken out on this home.
Original Mortgage
$459,000
Interest Rate
4.4%
Mortgage Type
New Conventional
Purchase Details
Closed on
Apr 12, 2018
Sold by
Philbert As Receiver Jason Wade and %
Bought by
New Hope & Beyond Inc
Purchase Details
Closed on
Oct 27, 2005
Sold by
Lashley John and Lashley Michelle
Bought by
Philbert Jason W and Strong Philbert Tawana
Home Financials for this Owner
Home Financials are based on the most recent Mortgage that was taken out on this home.
Original Mortgage
$66,000
Interest Rate
5.93%
Create a Home Valuation Report for This Property
The Home Valuation Report is an in-depth analysis detailing your home's value as well as a comparison with similar homes in the area
Home Values in the Area
Average Home Value in this Area
Purchase History
| Date | Buyer | Sale Price | Title Company |
|---|---|---|---|
| Pilatasig Moposita Jaime R | -- | -- | |
| Pilatasig Moposita Jaime R | $510,000 | -- | |
| New Hope & Beyond Inc | $215,000 | -- | |
| Philbert Jason W | $330,000 | -- | |
| Philbert Jason W | $330,000 | -- | |
| Philbert Jason W | $330,000 | -- |
Source: Public Records
Mortgage History
| Date | Status | Borrower | Loan Amount |
|---|---|---|---|
| Previous Owner | Pilatasig Moposita Jaime R | $459,000 | |
| Previous Owner | Philbert Jason W | $66,000 | |
| Previous Owner | Philbert Jason W | $264,000 |
Source: Public Records
Tax History Compared to Growth
Tax History
| Year | Tax Paid | Tax Assessment Tax Assessment Total Assessment is a certain percentage of the fair market value that is determined by local assessors to be the total taxable value of land and additions on the property. | Land | Improvement |
|---|---|---|---|---|
| 2025 | $4,278 | $32,580 | $13,980 | $18,600 |
| 2024 | $4,278 | $35,640 | $13,980 | $21,660 |
| 2023 | $4,326 | $37,500 | $13,980 | $23,520 |
| 2022 | $4,219 | $30,900 | $13,980 | $16,920 |
| 2021 | $4,196 | $28,440 | $13,980 | $14,460 |
| 2020 | $1,968 | $23,760 | $13,980 | $9,780 |
| 2019 | $3,713 | $23,340 | $13,980 | $9,360 |
| 2018 | $3,618 | $17,749 | $10,062 | $7,687 |
| 2017 | $3,590 | $17,612 | $12,784 | $4,828 |
| 2016 | $3,322 | $16,616 | $13,124 | $3,492 |
| 2015 | $2,004 | $15,676 | $10,037 | $5,639 |
| 2014 | $2,004 | $14,791 | $8,038 | $6,753 |
Source: Public Records
Map
Nearby Homes
- 548 Rockaway Ave
- 601 Thomas S Boyland St
- 600 Thomas S Boyland St
- 117 Osborn St
- 67 Chester St Unit 3
- 124 Herzl St
- 96 Herzl St
- 51 Chester St
- 101 Belmont Ave
- 1585 Pitkin Ave
- 105 Belmont Ave
- 2029 Strauss St
- 1782 Pitkin Ave
- 2041 Strauss St
- 256 Herzl St
- 589 Saratoga Ave
- 637 Saratoga Ave
- 2044 Strauss St
- 671 Saratoga Ave
- 675 Saratoga Ave
- 201 Chester St
- 203 Chester St
- 205 Chester St
- 197 Chester St
- 207 Chester St
- 195 Chester St
- 209 Chester St
- 211 Chester St
- 538 Rockaway Ave
- 532 Rockaway Ave
- 540 Rockaway Ave
- 213 Chester St
- 530 Rockaway Ave
- 528 Rockaway Ave Unit 530
- 528-530 Rockaway Ave
- 215 Chester St
- 542 Rockaway Ave
- 217 Chester St
- 219 Chester St
- 259 Sutter Ave