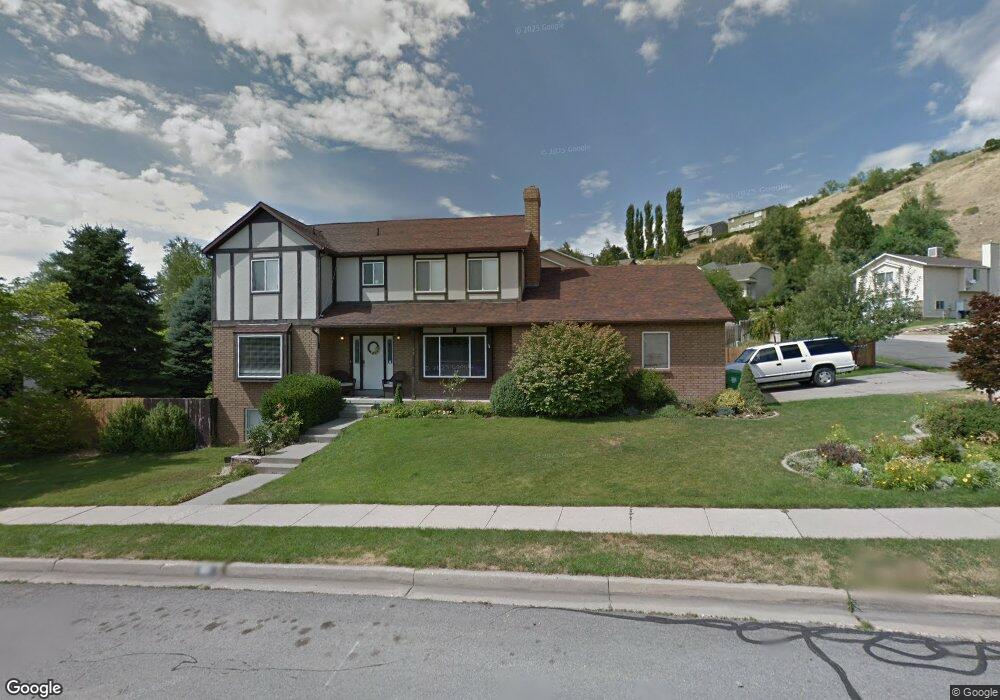
199 E 1975 N Centerville, UT 84014
Estimated Value: $645,000 - $730,767
6
Beds
4
Baths
3,562
Sq Ft
$194/Sq Ft
Est. Value
About This Home
This home is located at 199 E 1975 N, Centerville, UT 84014 and is currently estimated at $689,442, approximately $193 per square foot. 199 E 1975 N is a home located in Davis County with nearby schools including Reading School, Centerville Jr High, and Viewmont High School.
Ownership History
Date
Name
Owned For
Owner Type
Purchase Details
Closed on
May 2, 2022
Sold by
R & R Mann Family Trust
Bought by
Dirkmaat Gerrit D and Dirkmaat Kristin
Current Estimated Value
Home Financials for this Owner
Home Financials are based on the most recent Mortgage that was taken out on this home.
Original Mortgage
$435,000
Outstanding Balance
$406,102
Interest Rate
4.16%
Mortgage Type
New Conventional
Estimated Equity
$283,340
Purchase Details
Closed on
Jun 25, 2020
Sold by
Mann Richard and Mann Ranae
Bought by
Mann Richard and Mann Ranae
Home Financials for this Owner
Home Financials are based on the most recent Mortgage that was taken out on this home.
Original Mortgage
$322,000
Interest Rate
3.2%
Mortgage Type
New Conventional
Purchase Details
Closed on
Aug 2, 2019
Sold by
Mann Richard Grant and Mann Ranae Page
Bought by
Mann Richard and Mann Ranae
Purchase Details
Closed on
Jun 11, 1999
Sold by
Schindler Ronald and Schindler Karen Lynn
Bought by
Mann Richard Grant and Mann Ranae Page
Home Financials for this Owner
Home Financials are based on the most recent Mortgage that was taken out on this home.
Original Mortgage
$163,000
Interest Rate
6.9%
Create a Home Valuation Report for This Property
The Home Valuation Report is an in-depth analysis detailing your home's value as well as a comparison with similar homes in the area
Purchase History
| Date | Buyer | Sale Price | Title Company |
|---|---|---|---|
| Dirkmaat Gerrit D | -- | Stewart Title Company | |
| Mann Richard | -- | Mountain View Title And E | |
| Mann Richard | -- | Mountain View Title & Es | |
| Mann Richard | -- | None Available | |
| Mann Richard Grant | -- | Bonneville Title Company Inc |
Source: Public Records
Mortgage History
| Date | Status | Borrower | Loan Amount |
|---|---|---|---|
| Open | Dirkmaat Gerrit D | $435,000 | |
| Previous Owner | Mann Richard | $322,000 | |
| Previous Owner | Mann Richard Grant | $163,000 |
Source: Public Records
Tax History
| Year | Tax Paid | Tax Assessment Tax Assessment Total Assessment is a certain percentage of the fair market value that is determined by local assessors to be the total taxable value of land and additions on the property. | Land | Improvement |
|---|---|---|---|---|
| 2025 | $3,901 | $328,350 | $160,690 | $167,660 |
| 2024 | $3,764 | $315,150 | $145,773 | $169,377 |
| 2023 | $3,569 | $541,000 | $237,353 | $303,647 |
| 2022 | $3,513 | $320,650 | $120,209 | $200,441 |
| 2021 | $3,095 | $438,000 | $185,435 | $252,565 |
| 2020 | $2,801 | $395,000 | $180,146 | $214,854 |
| 2019 | $2,824 | $392,000 | $177,339 | $214,661 |
| 2018 | $2,609 | $359,000 | $164,378 | $194,622 |
| 2016 | $2,208 | $170,280 | $56,973 | $113,307 |
| 2015 | $2,193 | $160,600 | $56,973 | $103,627 |
| 2014 | $2,195 | $165,677 | $56,973 | $108,704 |
| 2013 | -- | $141,343 | $41,993 | $99,350 |
Source: Public Records
Map
Nearby Homes
- 1893 N 100 E
- 5 W Summerhill Ln
- 63 W 1750 N
- 136 W Summerhill Ln
- 283 W Summerhill Ln
- 286 W Summerhill Ln
- 461 W Summerhill Ln
- 586 W 1950 N
- 551 W Summerhill Ln
- 354 S 525 W
- 393 S 525 W
- 374 S 525 W
- 373 S 525 W
- 386 S 525 W
- 145 Ford Canyon Dr
- 687 W 2025 N
- 2132 N 725 W
- 2136 N 725 W
- 1549 N 400 W
- 1692 Willow Creek Cir
Your Personal Tour Guide
Ask me questions while you tour the home.