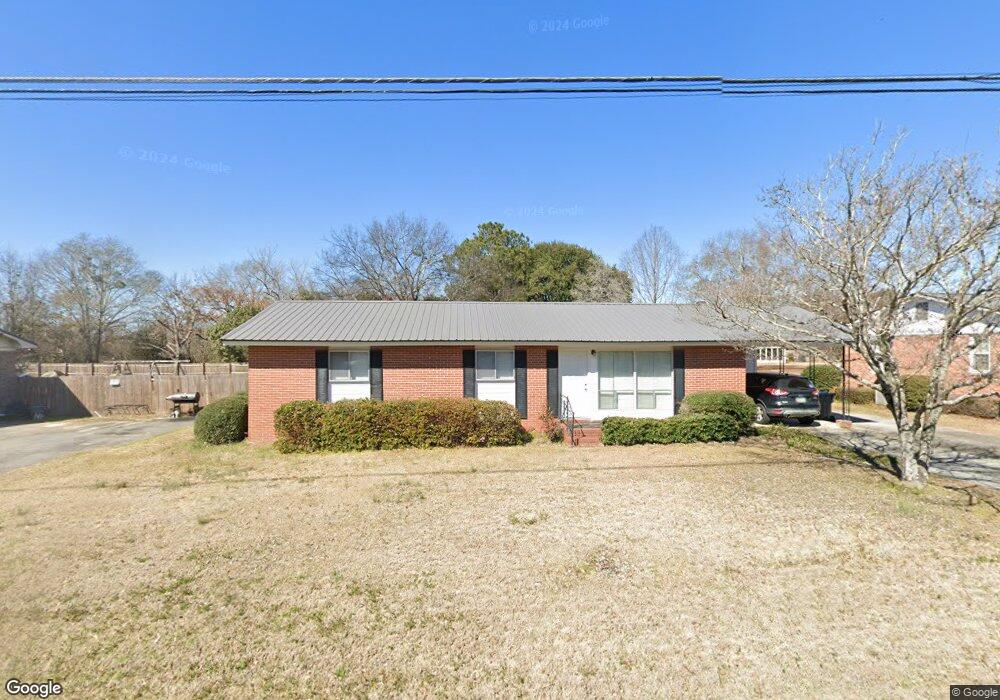
199 E Peter St Cochran, GA 31014
Estimated Value: $111,000 - $134,000
3
Beds
1
Bath
1,200
Sq Ft
$101/Sq Ft
Est. Value
About This Home
This home is located at 199 E Peter St, Cochran, GA 31014 and is currently estimated at $121,737, approximately $101 per square foot. 199 E Peter St is a home located in Bleckley County with nearby schools including Bleckley County Primary School, Bleckley County Elementary School, and Bleckley Middle School.
Ownership History
Date
Name
Owned For
Owner Type
Purchase Details
Closed on
Jun 28, 2018
Sold by
Brown Tonya W
Bought by
Grafton Steven C and Grafton Breanna C
Current Estimated Value
Home Financials for this Owner
Home Financials are based on the most recent Mortgage that was taken out on this home.
Original Mortgage
$68,939
Outstanding Balance
$59,369
Interest Rate
4.5%
Mortgage Type
New Conventional
Estimated Equity
$62,368
Purchase Details
Closed on
Nov 30, 2011
Sold by
Hall Brent N
Bought by
Brown Tonya W
Home Financials for this Owner
Home Financials are based on the most recent Mortgage that was taken out on this home.
Original Mortgage
$69,200
Interest Rate
3.87%
Mortgage Type
FHA
Purchase Details
Closed on
Dec 10, 2007
Sold by
Register Deborah
Bought by
Hall Brent N
Purchase Details
Closed on
Oct 14, 2005
Sold by
Hurst Sandra Fay
Bought by
Register Deborah
Purchase Details
Closed on
Sep 8, 1994
Bought by
Hurst Sandra F
Create a Home Valuation Report for This Property
The Home Valuation Report is an in-depth analysis detailing your home's value as well as a comparison with similar homes in the area
Home Values in the Area
Average Home Value in this Area
Purchase History
| Date | Buyer | Sale Price | Title Company |
|---|---|---|---|
| Grafton Steven C | $65,000 | -- | |
| Brown Tonya W | $71,000 | -- | |
| Hall Brent N | $50,000 | -- | |
| Register Deborah | $55,000 | -- | |
| Hurst Sandra F | $37,500 | -- |
Source: Public Records
Mortgage History
| Date | Status | Borrower | Loan Amount |
|---|---|---|---|
| Open | Grafton Steven C | $68,939 | |
| Previous Owner | Brown Tonya W | $69,200 |
Source: Public Records
Tax History
| Year | Tax Paid | Tax Assessment Tax Assessment Total Assessment is a certain percentage of the fair market value that is determined by local assessors to be the total taxable value of land and additions on the property. | Land | Improvement |
|---|---|---|---|---|
| 2025 | $1,570 | $43,440 | $1,480 | $41,960 |
| 2024 | $1,583 | $43,440 | $1,480 | $41,960 |
| 2023 | $1,554 | $39,400 | $1,480 | $37,920 |
| 2022 | $895 | $34,880 | $1,480 | $33,400 |
| 2021 | $696 | $26,520 | $1,480 | $25,040 |
| 2020 | $699 | $26,520 | $1,480 | $25,040 |
| 2019 | $607 | $23,290 | $3,200 | $20,090 |
| 2018 | $942 | $23,290 | $3,200 | $20,090 |
| 2017 | $615 | $23,290 | $3,200 | $20,090 |
| 2016 | $621 | $23,290 | $3,200 | $20,090 |
| 2015 | -- | $23,290 | $3,200 | $20,090 |
| 2014 | -- | $23,290 | $3,200 | $20,090 |
| 2013 | -- | $23,290 | $3,200 | $20,090 |
Source: Public Records
Map
Nearby Homes
- 132 Mcvay Dr
- 216 E Peter St
- 188 E Lewis St
- 113 Taylor Dr
- 0 Tiffany Dr Unit 10664262
- 260 Ann St
- 264 Ann St
- 104 S 4th St
- 161 E Cherry St
- 173 Berkley Rd
- 7 Evergreen Dr
- 116 W Lewis St
- 1277 Georgia 112
- 134 Easy St
- 0 Willow Creek Run
- 0 Wood Oak Cir Unit 233873
- 0 Wood Oak Cir Unit 9278951
- 288 Frank Cook Rd
- 175 Wood Oak Cir
- 169 W Dykes St
Your Personal Tour Guide
Ask me questions while you tour the home.