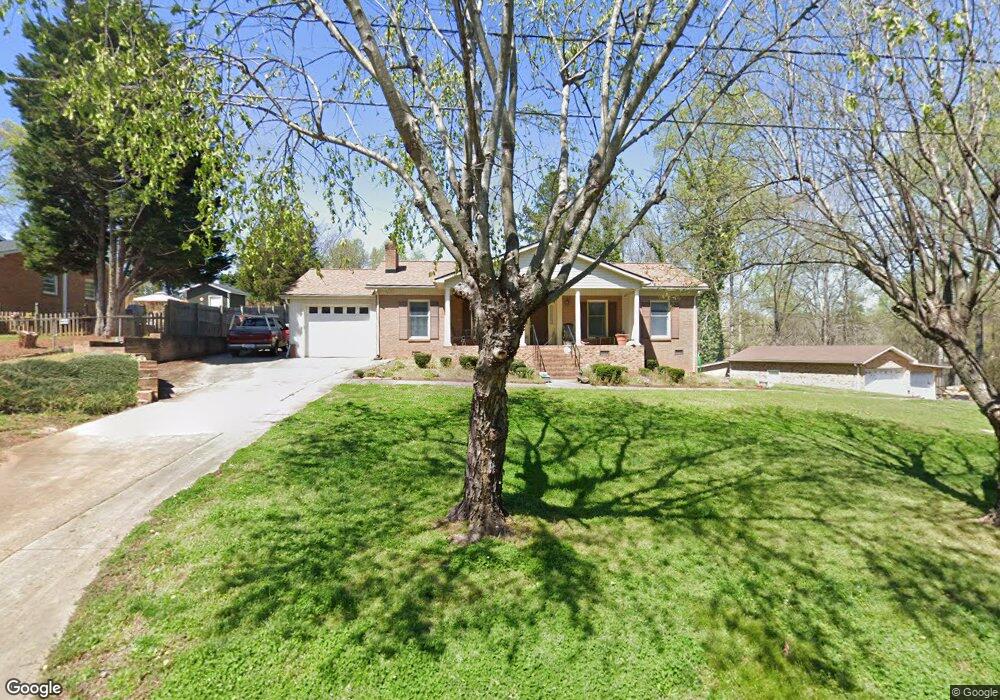
199 Fremont Loop Mooresville, NC 28115
Estimated Value: $289,000 - $408,000
3
Beds
2
Baths
1,340
Sq Ft
$254/Sq Ft
Est. Value
About This Home
This home is located at 199 Fremont Loop, Mooresville, NC 28115 and is currently estimated at $340,368, approximately $254 per square foot. 199 Fremont Loop is a home located in Iredell County with nearby schools including Coddle Creek Elementary School, Lake Norman High School, and Pine Lake Preparatory.
Ownership History
Date
Name
Owned For
Owner Type
Purchase Details
Closed on
Oct 29, 2021
Sold by
Hoover Patricia B
Bought by
Hoover Patricia B and Thompson Leonard
Current Estimated Value
Purchase Details
Closed on
Feb 2, 2009
Sold by
Hoover Roger E
Bought by
Hoover Patricia B
Home Financials for this Owner
Home Financials are based on the most recent Mortgage that was taken out on this home.
Original Mortgage
$155,260
Outstanding Balance
$98,876
Interest Rate
5.24%
Mortgage Type
Purchase Money Mortgage
Estimated Equity
$241,492
Purchase Details
Closed on
Jul 24, 2006
Sold by
Isenhour Walter Glenn and Isenhour Lelia H
Bought by
Hoover Roger E
Home Financials for this Owner
Home Financials are based on the most recent Mortgage that was taken out on this home.
Original Mortgage
$155,000
Interest Rate
6.6%
Mortgage Type
Purchase Money Mortgage
Purchase Details
Closed on
Jun 1, 1979
Purchase Details
Closed on
Jun 1, 1977
Create a Home Valuation Report for This Property
The Home Valuation Report is an in-depth analysis detailing your home's value as well as a comparison with similar homes in the area
Home Values in the Area
Average Home Value in this Area
Purchase History
| Date | Buyer | Sale Price | Title Company |
|---|---|---|---|
| Hoover Patricia B | -- | None Available | |
| Hoover Patricia B | $222,000 | None Available | |
| Hoover Roger E | $205,000 | None Available | |
| -- | -- | -- | |
| -- | $36,500 | -- |
Source: Public Records
Mortgage History
| Date | Status | Borrower | Loan Amount |
|---|---|---|---|
| Open | Hoover Patricia B | $155,260 | |
| Closed | Hoover Roger E | $155,000 |
Source: Public Records
Tax History Compared to Growth
Tax History
| Year | Tax Paid | Tax Assessment Tax Assessment Total Assessment is a certain percentage of the fair market value that is determined by local assessors to be the total taxable value of land and additions on the property. | Land | Improvement |
|---|---|---|---|---|
| 2024 | $906 | $289,710 | $47,000 | $242,710 |
| 2023 | $906 | $289,710 | $47,000 | $242,710 |
| 2022 | $610 | $177,400 | $35,000 | $142,400 |
| 2021 | $608 | $177,400 | $35,000 | $142,400 |
| 2020 | $608 | $177,400 | $35,000 | $142,400 |
| 2019 | $580 | $177,400 | $35,000 | $142,400 |
| 2018 | $536 | $166,010 | $35,000 | $131,010 |
| 2017 | $536 | $166,010 | $35,000 | $131,010 |
| 2016 | $536 | $166,010 | $35,000 | $131,010 |
| 2015 | $532 | $166,010 | $35,000 | $131,010 |
| 2014 | $510 | $173,650 | $35,000 | $138,650 |
Source: Public Records
Map
Nearby Homes
- 0 Fremont Loop Unit CAR4278290
- 161 Oxford Dr
- 149 Oxford Dr
- 190 Welcombe St
- 235 Alexandria Dr
- 118 Steam Engine Dr Unit 205
- 207 Welcombe St
- 145 Stibbs Cross Rd
- 169 Holsworthy Dr
- 168 Holsworthy Dr
- 104 Leslie Loop
- 193 Holsworthy Dr
- 197 Holsworthy Dr
- 179 Holsworthy Dr
- 143 Goorawing Ln
- 109 Ciara Place
- 109 Ciara Place Unit B
- 109 Ciara Place Unit A
- 128 Tetcott St
- 115 Ciara Place Unit C
- 195 Fremont Loop
- 189 Fremont Loop
- 196 Fremont Loop
- 205 Fremont Loop
- 190 Fremont Loop
- 183 Fremont Loop
- 184 Fremont Loop
- 211 Fremont Loop
- 140 Locomotive Ln Unit 109
- 140 Locomotive Ln Unit 111
- 140 Locomotive Ln Unit 102
- 140 Locomotive Ln Unit 110
- 140 Locomotive Ln Unit 108
- 140 Locomotive Ln Unit 106
- 140 Locomotive Ln Unit 105
- 140 Locomotive Ln Unit 104
- 140 Locomotive Ln Unit 103
- 140 Locomotive Ln Unit 101
- 140 Locomotive Ln
- 179 Fremont Loop