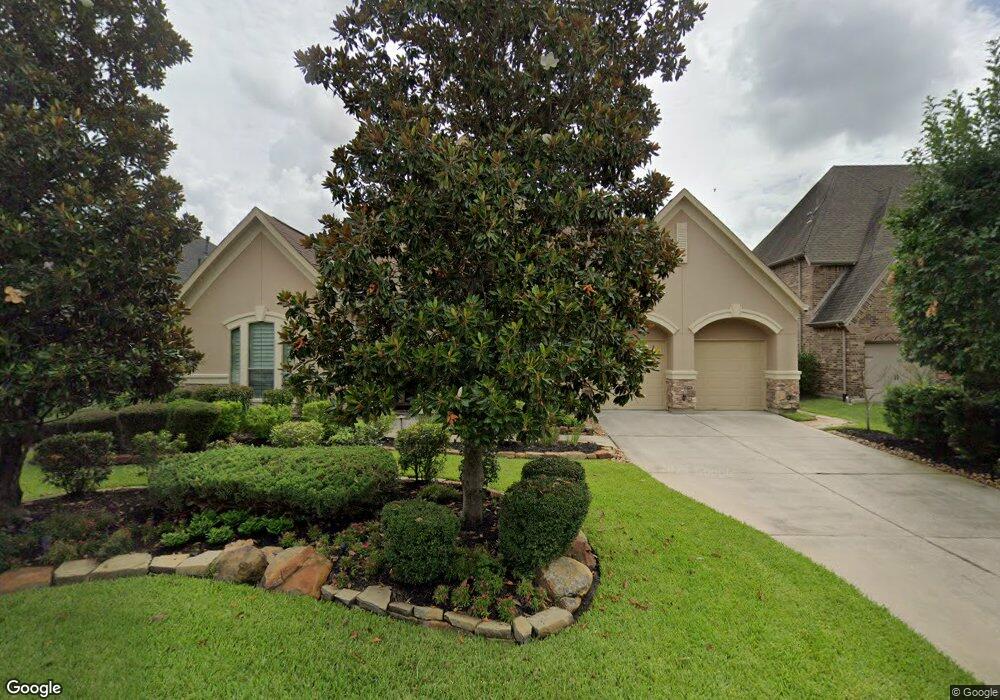
199 Greylake Place Magnolia, TX 77354
Sterling Ridge NeighborhoodEstimated Value: $720,000 - $801,000
4
Beds
5
Baths
3,697
Sq Ft
$202/Sq Ft
Est. Value
About This Home
This home is located at 199 Greylake Place, Magnolia, TX 77354 and is currently estimated at $745,730, approximately $201 per square foot. 199 Greylake Place is a home located in Montgomery County with nearby schools including Cedric C Smith, Bear Branch Junior High School, and Magnolia High School.
Ownership History
Date
Name
Owned For
Owner Type
Purchase Details
Closed on
Jan 15, 2013
Sold by
Jones Kenneth D and Wright Patricia S
Bought by
Odonnell Michael J and Odonnell Phyllis J
Current Estimated Value
Home Financials for this Owner
Home Financials are based on the most recent Mortgage that was taken out on this home.
Original Mortgage
$159,000
Outstanding Balance
$110,398
Interest Rate
3.34%
Mortgage Type
New Conventional
Estimated Equity
$635,332
Purchase Details
Closed on
Mar 25, 2011
Sold by
Partners In Building L P
Bought by
Jones Kenneth D and Wright Patricia S
Purchase Details
Closed on
May 18, 2010
Sold by
Woodlands Land Development Company Lp
Bought by
Partners In Building Lp
Home Financials for this Owner
Home Financials are based on the most recent Mortgage that was taken out on this home.
Original Mortgage
$326,400
Interest Rate
5%
Mortgage Type
Purchase Money Mortgage
Create a Home Valuation Report for This Property
The Home Valuation Report is an in-depth analysis detailing your home's value as well as a comparison with similar homes in the area
Home Values in the Area
Average Home Value in this Area
Purchase History
| Date | Buyer | Sale Price | Title Company |
|---|---|---|---|
| Odonnell Michael J | -- | Stewart Title Of Montgomery | |
| Jones Kenneth D | -- | Startex Title Company | |
| Partners In Building Lp | -- | None Available |
Source: Public Records
Mortgage History
| Date | Status | Borrower | Loan Amount |
|---|---|---|---|
| Open | Odonnell Michael J | $159,000 | |
| Previous Owner | Partners In Building Lp | $326,400 |
Source: Public Records
Tax History Compared to Growth
Tax History
| Year | Tax Paid | Tax Assessment Tax Assessment Total Assessment is a certain percentage of the fair market value that is determined by local assessors to be the total taxable value of land and additions on the property. | Land | Improvement |
|---|---|---|---|---|
| 2025 | $10,383 | $685,162 | $120,000 | $565,162 |
| 2024 | $9,855 | $668,173 | -- | -- |
| 2023 | $9,855 | $607,430 | $120,000 | $556,220 |
| 2022 | $13,001 | $552,210 | $120,000 | $541,780 |
| 2021 | $12,415 | $502,010 | $46,470 | $473,120 |
| 2020 | $12,038 | $456,370 | $46,470 | $409,900 |
| 2019 | $12,460 | $460,430 | $46,470 | $413,960 |
| 2018 | $11,302 | $469,030 | $46,470 | $422,560 |
| 2017 | $12,830 | $469,030 | $46,470 | $422,560 |
| 2016 | $14,109 | $515,780 | $46,470 | $469,310 |
| 2015 | $11,952 | $469,030 | $46,470 | $422,560 |
| 2014 | $11,952 | $434,980 | $46,470 | $388,510 |
Source: Public Records
Map
Nearby Homes
- 203 Greylake Place
- 210 Greylake Place
- 175 N Almondell Way
- 158 N Almondell Way
- 16 Florentino Vine Place
- 14 Trailing Lantana Place
- 126 Hearthshire Cir
- 70 S Almondell Cir S
- 66 Hearthshire Cir
- 10 Barker Ridge Ct
- 8486 Sweet Cherry Ln
- 8406 Matthews Ln
- 8618 Blueberry Ash St
- 8611 Blueberry Ash St
- 30 Black Swan Ct
- 8610 Blueberry Ash St
- 8603 Blueberry Ash St
- 2 Craven Park Ct
- 28536 Fm 2978 Rd
- 207 N Vershire Cir
- 195 Greylake Place
- 207 Greylake Place
- 191 Greylake Place
- 198 Greylake Place
- 211 Greylake Place
- 202 Greylake Place
- 206 Greylake Place
- 187 Greylake Place
- 179 N Almondell Way
- 183 N Almondell Way
- 174 N Almondell Way
- 219 Greylake Place
- 215 Greylake Place
- 14 S Almondell Way
- 170 N Almondell Way
- 171 N Almondell Way
- 143 Bloomhill Place
- 147 Bloomhill Place
- 139 Bloomhill Place
- 7 S Almondell Way