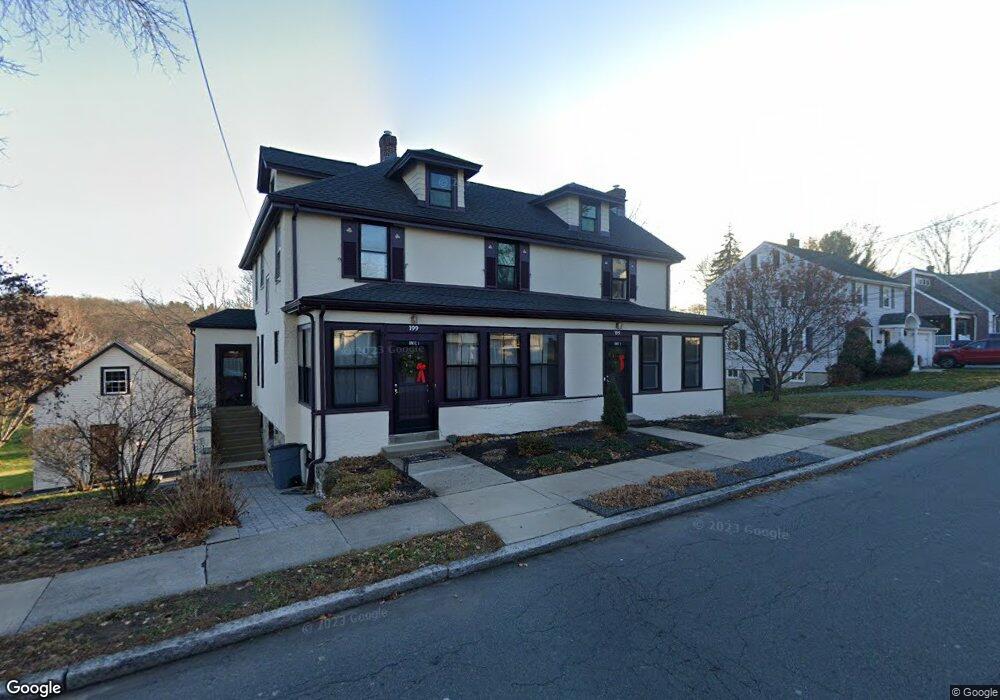
199 Laurel St Unit B Melrose, MA 02176
Melrose East Side NeighborhoodEstimated Value: $455,000 - $491,000
2
Beds
1
Bath
1,100
Sq Ft
$431/Sq Ft
Est. Value
About This Home
This home is located at 199 Laurel St Unit B, Melrose, MA 02176 and is currently estimated at $474,066, approximately $430 per square foot. 199 Laurel St Unit B is a home located in Middlesex County with nearby schools including Winthrop Elementary School, Hoover Elementary School, and Horace Mann Elementary School.
Ownership History
Date
Name
Owned For
Owner Type
Purchase Details
Closed on
Sep 13, 2022
Sold by
199 Laurel Street Llc
Bought by
Robert P Costa Ft
Current Estimated Value
Purchase Details
Closed on
Apr 7, 2019
Sold by
Robert P Costa Ft
Bought by
199 Laurel Street Llc
Purchase Details
Closed on
Jun 28, 2004
Sold by
Gabler Karen M and Costa Robert P
Bought by
Costa Robert P
Create a Home Valuation Report for This Property
The Home Valuation Report is an in-depth analysis detailing your home's value as well as a comparison with similar homes in the area
Home Values in the Area
Average Home Value in this Area
Purchase History
| Date | Buyer | Sale Price | Title Company |
|---|---|---|---|
| Robert P Costa Ft | -- | None Available | |
| 199 Laurel Street Llc | -- | -- | |
| Costa Robert P | -- | -- |
Source: Public Records
Tax History Compared to Growth
Tax History
| Year | Tax Paid | Tax Assessment Tax Assessment Total Assessment is a certain percentage of the fair market value that is determined by local assessors to be the total taxable value of land and additions on the property. | Land | Improvement |
|---|---|---|---|---|
| 2025 | $34 | $344,800 | $0 | $344,800 |
| 2024 | $3,284 | $330,700 | $0 | $330,700 |
| 2023 | $3,349 | $321,400 | $0 | $321,400 |
| 2022 | $3,260 | $308,400 | $0 | $308,400 |
| 2021 | $3,275 | $299,100 | $0 | $299,100 |
| 2020 | $3,305 | $299,100 | $0 | $299,100 |
| 2019 | $3,033 | $280,600 | $0 | $280,600 |
| 2018 | $2,927 | $258,300 | $0 | $258,300 |
| 2017 | $2,938 | $249,000 | $0 | $249,000 |
| 2016 | $2,841 | $230,400 | $0 | $230,400 |
| 2015 | $2,986 | $230,400 | $0 | $230,400 |
| 2014 | $2,961 | $223,000 | $0 | $223,000 |
Source: Public Records
Map
Nearby Homes
- 257 1st St
- 30 Wheeler Ave
- 36 Slayton Rd
- 16 Plymouth Cir
- 33 Mount Hood Terrace
- 218 Upham St
- 26 Magnolia Rd
- 1 Mill Rd
- 118 N Woodcrest Dr
- 515 Upham St
- 519 Essex St
- 46 Country Club Rd
- 55 Burrell St
- 110 Ellis Farm Ln
- 65 Beacon St
- 42 Fairfield Ave
- 4 Cheever Ave
- 12B Cheever Ave
- 12C Cheever Ave
- 27 Temple St