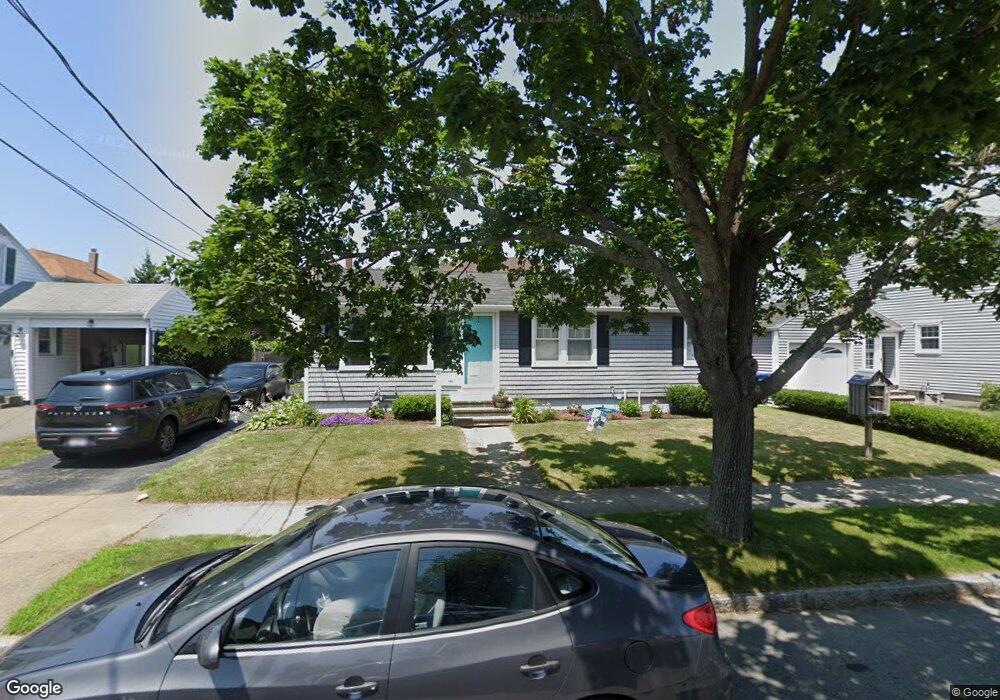
199 Matthew St New Bedford, MA 02740
The South End NeighborhoodEstimated Value: $387,000 - $444,000
3
Beds
2
Baths
960
Sq Ft
$438/Sq Ft
Est. Value
About This Home
This home is located at 199 Matthew St, New Bedford, MA 02740 and is currently estimated at $420,581, approximately $438 per square foot. 199 Matthew St is a home located in Bristol County with nearby schools including Betsey B. Winslow Elementary School, Keith Middle School, and New Bedford High School.
Ownership History
Date
Name
Owned For
Owner Type
Purchase Details
Closed on
Jul 14, 2017
Sold by
Centeio-Mahmoud Paula
Bought by
Centeio-Mahmoud Paula and Mahmoud David
Current Estimated Value
Purchase Details
Closed on
Nov 21, 2003
Sold by
Goulart Thomas Joseph
Bought by
Barros Paula M
Home Financials for this Owner
Home Financials are based on the most recent Mortgage that was taken out on this home.
Original Mortgage
$176,000
Interest Rate
5.98%
Mortgage Type
Purchase Money Mortgage
Create a Home Valuation Report for This Property
The Home Valuation Report is an in-depth analysis detailing your home's value as well as a comparison with similar homes in the area
Home Values in the Area
Average Home Value in this Area
Purchase History
| Date | Buyer | Sale Price | Title Company |
|---|---|---|---|
| Centeio-Mahmoud Paula | -- | -- | |
| Centeio-Mahmoud Paula | -- | -- | |
| Barros Paula M | $230,000 | -- | |
| Barros Paula M | $230,000 | -- |
Source: Public Records
Mortgage History
| Date | Status | Borrower | Loan Amount |
|---|---|---|---|
| Previous Owner | Barros Paula M | $203,000 | |
| Previous Owner | Barros Paula M | $176,000 |
Source: Public Records
Tax History Compared to Growth
Tax History
| Year | Tax Paid | Tax Assessment Tax Assessment Total Assessment is a certain percentage of the fair market value that is determined by local assessors to be the total taxable value of land and additions on the property. | Land | Improvement |
|---|---|---|---|---|
| 2025 | $4,275 | $378,000 | $104,200 | $273,800 |
| 2024 | $3,989 | $332,400 | $105,900 | $226,500 |
| 2023 | $4,291 | $300,300 | $91,300 | $209,000 |
| 2022 | $3,876 | $249,400 | $86,800 | $162,600 |
| 2021 | $3,793 | $243,300 | $86,800 | $156,500 |
| 2020 | $3,693 | $228,500 | $86,800 | $141,700 |
| 2019 | $3,625 | $220,100 | $86,800 | $133,300 |
| 2018 | $4,531 | $201,000 | $86,800 | $114,200 |
| 2017 | $3,193 | $191,300 | $86,800 | $104,500 |
| 2016 | $3,011 | $182,600 | $86,800 | $95,800 |
| 2015 | $2,945 | $187,200 | $86,800 | $100,400 |
| 2014 | $2,771 | $182,800 | $81,600 | $101,200 |
Source: Public Records
Map
Nearby Homes