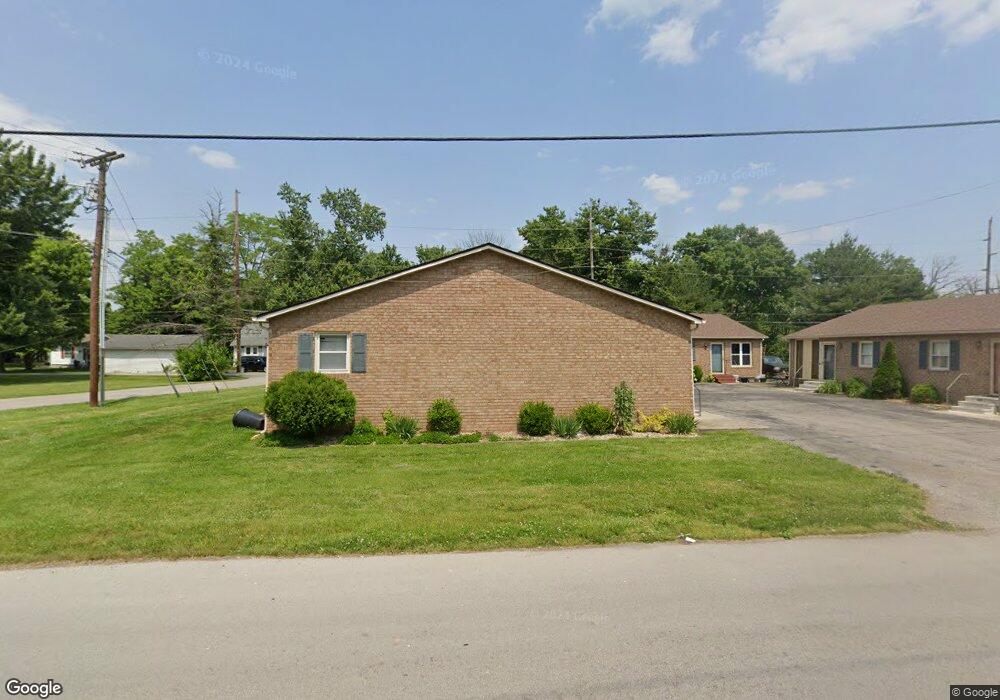
199 N High St Austin, IN 47102
Estimated Value: $203,000 - $298,000
2
Beds
1
Bath
1,813
Sq Ft
$134/Sq Ft
Est. Value
About This Home
This home is located at 199 N High St, Austin, IN 47102 and is currently estimated at $242,388, approximately $133 per square foot. 199 N High St is a home located in Scott County with nearby schools including Austin Elementary School, Austin Middle School, and Austin High School.
Ownership History
Date
Name
Owned For
Owner Type
Purchase Details
Closed on
Jul 24, 2020
Sold by
West Mary Jo and Bradley Carol Lyn
Bought by
Sebastian Samuel Scott and Sebastian Kimberley Lynn
Current Estimated Value
Home Financials for this Owner
Home Financials are based on the most recent Mortgage that was taken out on this home.
Original Mortgage
$160,000
Outstanding Balance
$113,043
Interest Rate
3.1%
Mortgage Type
Commercial
Estimated Equity
$129,345
Purchase Details
Closed on
Aug 17, 2018
Sold by
Shields Mary Jane and Shields Joe W
Bought by
West Mary Jo and Bradley Carol Lyn
Create a Home Valuation Report for This Property
The Home Valuation Report is an in-depth analysis detailing your home's value as well as a comparison with similar homes in the area
Home Values in the Area
Average Home Value in this Area
Purchase History
| Date | Buyer | Sale Price | Title Company |
|---|---|---|---|
| Sebastian Samuel Scott | -- | None Available | |
| West Mary Jo | -- | None Available |
Source: Public Records
Mortgage History
| Date | Status | Borrower | Loan Amount |
|---|---|---|---|
| Open | Sebastian Samuel Scott | $160,000 |
Source: Public Records
Tax History
| Year | Tax Paid | Tax Assessment Tax Assessment Total Assessment is a certain percentage of the fair market value that is determined by local assessors to be the total taxable value of land and additions on the property. | Land | Improvement |
|---|---|---|---|---|
| 2024 | $3,867 | $157,700 | $11,000 | $146,700 |
| 2023 | $4,258 | $161,000 | $11,000 | $150,000 |
| 2022 | $4,421 | $200,300 | $11,000 | $189,300 |
| 2021 | $4,261 | $205,700 | $11,000 | $194,700 |
| 2020 | $4,114 | $205,700 | $11,000 | $194,700 |
| 2019 | $4,222 | $211,100 | $11,000 | $200,100 |
| 2018 | $4,174 | $208,700 | $11,000 | $197,700 |
| 2017 | $4,156 | $207,800 | $11,000 | $196,800 |
| 2016 | $4,108 | $205,400 | $11,000 | $194,400 |
| 2014 | $4,210 | $210,500 | $11,000 | $199,500 |
| 2013 | $4,210 | $210,500 | $11,000 | $199,500 |
Source: Public Records
Map
Nearby Homes
Your Personal Tour Guide
Ask me questions while you tour the home.