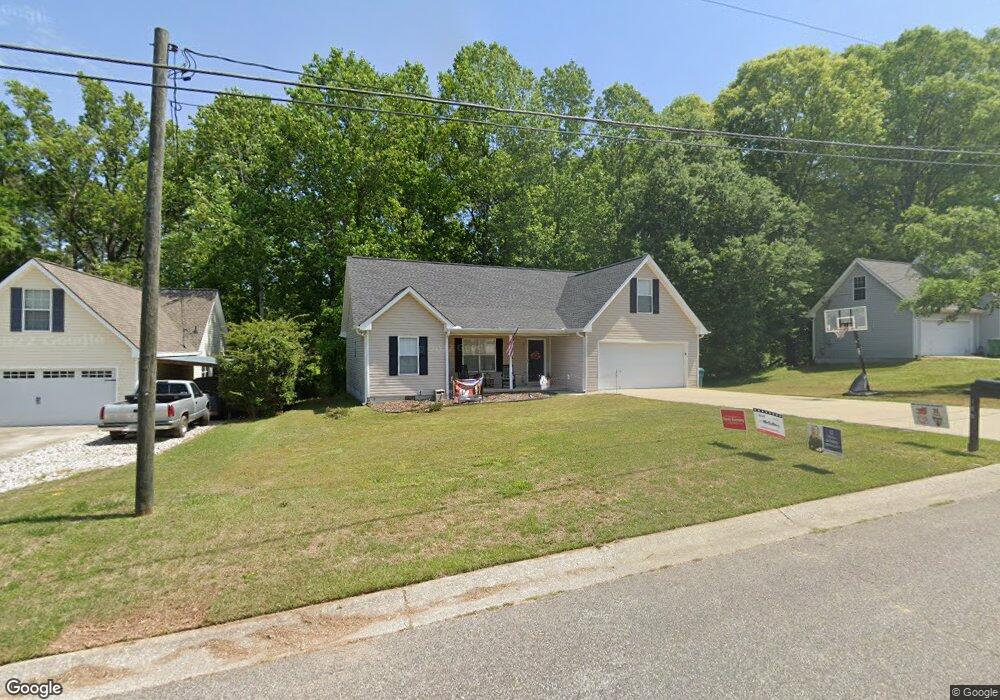
199 Pine Rock Rd Winder, GA 30680
Estimated Value: $311,490 - $330,000
3
Beds
2
Baths
1,486
Sq Ft
$216/Sq Ft
Est. Value
About This Home
This home is located at 199 Pine Rock Rd, Winder, GA 30680 and is currently estimated at $320,623, approximately $215 per square foot. 199 Pine Rock Rd is a home located in Barrow County with nearby schools including County Line Elementary School, Russell Middle School, and Winder-Barrow High School.
Ownership History
Date
Name
Owned For
Owner Type
Purchase Details
Closed on
Dec 31, 2020
Sold by
Pack Abigail Amazone
Bought by
Sfr Jv 1 Property Llc
Current Estimated Value
Purchase Details
Closed on
Nov 9, 2020
Sold by
Calhoun Malachi Lestat
Bought by
Pack Abigail Amazone
Purchase Details
Closed on
May 30, 2001
Sold by
Hunter-Frost Inc
Bought by
Calhoun Willam D and Calhoun Debra A
Home Financials for this Owner
Home Financials are based on the most recent Mortgage that was taken out on this home.
Original Mortgage
$106,556
Interest Rate
7.11%
Mortgage Type
FHA
Purchase Details
Closed on
Dec 15, 2000
Sold by
Hunter-Frost Inc
Bought by
Emery Gregory G
Home Financials for this Owner
Home Financials are based on the most recent Mortgage that was taken out on this home.
Original Mortgage
$107,300
Interest Rate
7.79%
Mortgage Type
FHA
Create a Home Valuation Report for This Property
The Home Valuation Report is an in-depth analysis detailing your home's value as well as a comparison with similar homes in the area
Home Values in the Area
Average Home Value in this Area
Purchase History
| Date | Buyer | Sale Price | Title Company |
|---|---|---|---|
| Sfr Jv 1 Property Llc | $205,000 | -- | |
| Pack Abigail Amazone | -- | -- | |
| Pack Abigail Amazone | -- | -- | |
| Pack Abigail Amazone | -- | -- | |
| Calhoun Willam D | $108,000 | -- | |
| Emery Gregory G | $108,200 | -- |
Source: Public Records
Mortgage History
| Date | Status | Borrower | Loan Amount |
|---|---|---|---|
| Previous Owner | Calhoun Willam D | $106,556 | |
| Previous Owner | Emery Gregory G | $107,300 |
Source: Public Records
Tax History Compared to Growth
Tax History
| Year | Tax Paid | Tax Assessment Tax Assessment Total Assessment is a certain percentage of the fair market value that is determined by local assessors to be the total taxable value of land and additions on the property. | Land | Improvement |
|---|---|---|---|---|
| 2024 | $2,629 | $92,688 | $19,200 | $73,488 |
| 2023 | $2,236 | $92,688 | $19,200 | $73,488 |
| 2022 | $2,818 | $82,726 | $19,200 | $63,526 |
| 2021 | $2,568 | $70,499 | $14,400 | $56,099 |
| 2020 | $1,890 | $53,581 | $11,600 | $41,981 |
| 2019 | $1,860 | $51,918 | $11,600 | $40,318 |
| 2018 | $1,691 | $46,928 | $11,600 | $35,328 |
| 2017 | $1,162 | $38,935 | $11,600 | $27,335 |
| 2016 | $1,347 | $39,248 | $11,600 | $27,648 |
| 2015 | $1,359 | $39,562 | $11,600 | $27,962 |
| 2014 | $1,209 | $34,822 | $6,860 | $27,962 |
| 2013 | -- | $33,474 | $6,860 | $26,614 |
Source: Public Records
Map
Nearby Homes
- 303 Rocky Point Ct
- 197 Buena Vista St
- 326 Miles Patrick Rd
- 352 3rd Ave
- 172 Settle St
- 256 4th Ave
- 311 2nd Ave
- 401 N 5th Ave
- 27 Creekside Dr
- 253 3rd Ave
- 217 Bellview St
- 0 W Williams St Unit 10464682
- 311 N Broad St
- 0 Jerome St Unit 7439149
- 0 Jerome St Unit 10359679
- 5 Olevia St
- 17 W Wright St
- 254 Partridge Trail
- 0 E Northcrest Dr Unit 10648147
- 171 Brookview Terrace
- 197 Pine Rock Rd
- 201 Pine Rock Rd
- 195 Pine Rock Rd
- 203 Pine Rock Rd
- 200 Pine Rock Rd
- 193 Pine Rock Rd
- 204 Pine Rock Rd
- 202 Pine Rock Rd
- 352 Fall View Ct
- 194 Pine Rock Rd
- 828 Lakeshore Dr
- 832 Lakeshore Dr
- 353 Fall View Ct
- 191 Pine Rock Rd
- 838 Lakeshore Dr
- 820 Lakeshore Dr
- 814 Lakeshore Dr
- 192 Pine Rock Rd
- 848 Lakeshore Dr
- 354 Fall View Ct