Estimated Value: $169,000 - $183,463
3
Beds
1
Bath
1,197
Sq Ft
$147/Sq Ft
Est. Value
About This Home
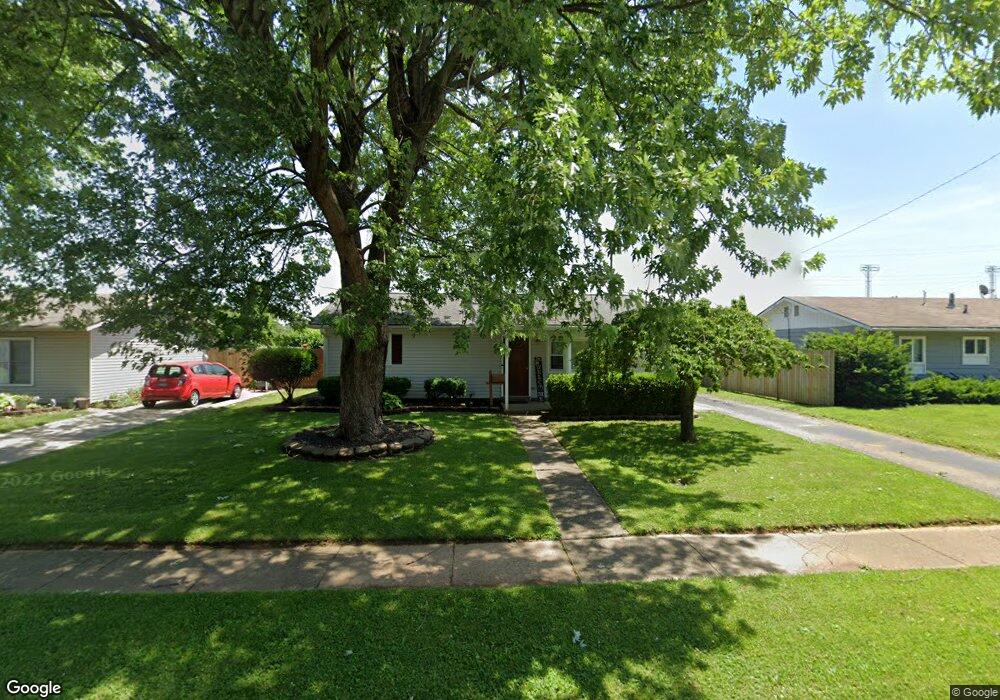
This home is located at 199 Poe Ln, Xenia, OH 45385 and is currently estimated at $176,116, approximately $147 per square foot. 199 Poe Ln is a home located in Greene County with nearby schools including Xenia High School, Summit Academy Community School for Alternative Learners - Xenia, and Legacy Christian Academy.
Ownership History
Date
Name
Owned For
Owner Type
Purchase Details
Closed on
Dec 29, 2020
Sold by
Thomas John H and Thomas Loren B
Bought by
Ratcliffe Marissa A and Robbins Brandon M
Current Estimated Value
Home Financials for this Owner
Home Financials are based on the most recent Mortgage that was taken out on this home.
Original Mortgage
$114,880
Outstanding Balance
$102,531
Interest Rate
2.71%
Mortgage Type
FHA
Estimated Equity
$73,585
Purchase Details
Closed on
Feb 1, 2020
Sold by
Thomas John H and Thomas Loren B
Bought by
Ratcliffe Marissa A and Robbins Brandon M
Home Financials for this Owner
Home Financials are based on the most recent Mortgage that was taken out on this home.
Original Mortgage
$114,880
Interest Rate
2.71%
Mortgage Type
FHA
Purchase Details
Closed on
Aug 31, 2009
Sold by
Cline Sandi K
Bought by
Thomas John H and Thomas Loren B
Home Financials for this Owner
Home Financials are based on the most recent Mortgage that was taken out on this home.
Original Mortgage
$90,400
Interest Rate
5.32%
Mortgage Type
VA
Purchase Details
Closed on
Aug 4, 1994
Sold by
Mcgrew Daniel D
Bought by
Cline Sandi K
Home Financials for this Owner
Home Financials are based on the most recent Mortgage that was taken out on this home.
Original Mortgage
$59,450
Interest Rate
8.53%
Mortgage Type
New Conventional
Create a Home Valuation Report for This Property
The Home Valuation Report is an in-depth analysis detailing your home's value as well as a comparison with similar homes in the area
Home Values in the Area
Average Home Value in this Area
Purchase History
| Date | Buyer | Sale Price | Title Company |
|---|---|---|---|
| Ratcliffe Marissa A | -- | None Listed On Document | |
| Ratcliffe Marissa A | $117,000 | None Available | |
| Thomas John H | $90,400 | Midwest Title Company | |
| Cline Sandi K | $62,600 | -- |
Source: Public Records
Mortgage History
| Date | Status | Borrower | Loan Amount |
|---|---|---|---|
| Open | Ratcliffe Marissa A | $114,880 | |
| Previous Owner | Ratcliffe Marissa A | $114,880 | |
| Previous Owner | Thomas John H | $90,400 | |
| Previous Owner | Cline Sandi K | $59,450 |
Source: Public Records
Tax History Compared to Growth
Tax History
| Year | Tax Paid | Tax Assessment Tax Assessment Total Assessment is a certain percentage of the fair market value that is determined by local assessors to be the total taxable value of land and additions on the property. | Land | Improvement |
|---|---|---|---|---|
| 2024 | $1,994 | $46,590 | $9,350 | $37,240 |
| 2023 | $1,994 | $46,590 | $9,350 | $37,240 |
| 2022 | $1,657 | $33,020 | $6,680 | $26,340 |
| 2021 | $1,547 | $30,430 | $6,680 | $23,750 |
| 2020 | $1,482 | $30,430 | $6,680 | $23,750 |
| 2019 | $1,160 | $22,410 | $4,600 | $17,810 |
| 2018 | $1,164 | $22,410 | $4,600 | $17,810 |
| 2017 | $1,103 | $22,410 | $4,600 | $17,810 |
| 2016 | $1,103 | $20,840 | $4,600 | $16,240 |
| 2015 | $1,106 | $20,840 | $4,600 | $16,240 |
| 2014 | $1,059 | $20,840 | $4,600 | $16,240 |
Source: Public Records
Map
Nearby Homes