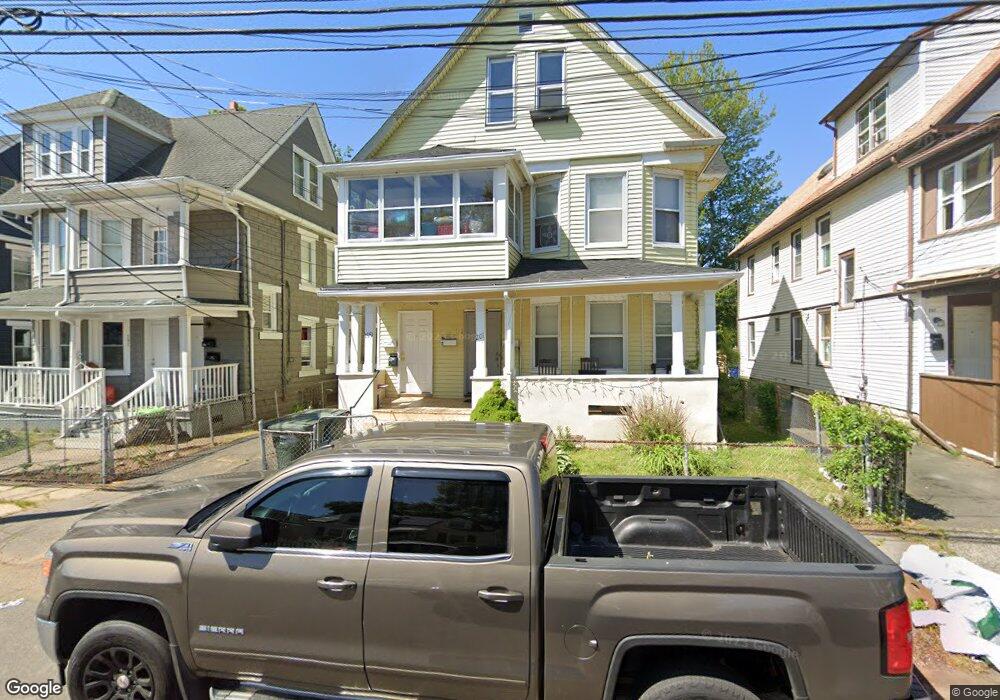
199 Read St Unit 2ND Bridgeport, CT 06607
East End NeighborhoodEstimated Value: $302,352 - $454,000
2
Beds
2
Baths
3,233
Sq Ft
$119/Sq Ft
Est. Value
About This Home
This home is located at 199 Read St Unit 2ND, Bridgeport, CT 06607 and is currently estimated at $384,088, approximately $118 per square foot. 199 Read St Unit 2ND is a home located in Fairfield County with nearby schools including Jettie S. Tisdale School, Harding High School, and Capital Prep Harbor Upper School.
Ownership History
Date
Name
Owned For
Owner Type
Purchase Details
Closed on
Nov 2, 2016
Sold by
Escarate Enrique
Bought by
Williams Clint
Current Estimated Value
Home Financials for this Owner
Home Financials are based on the most recent Mortgage that was taken out on this home.
Original Mortgage
$82,500
Interest Rate
3.48%
Mortgage Type
Unknown
Purchase Details
Closed on
Aug 2, 2010
Sold by
Fhlmc
Bought by
Socarate Enrique
Purchase Details
Closed on
Feb 22, 2010
Sold by
Chase Home Finance Llc
Bought by
Federal National Mortgage Association
Purchase Details
Closed on
Feb 1, 2010
Sold by
Berroa John
Bought by
Chase Home Finance
Purchase Details
Closed on
Jun 9, 2006
Sold by
Cepeda Nelson
Bought by
Berroa John
Purchase Details
Closed on
Oct 8, 2002
Sold by
Olavarria Reynaldo and Olavarria Marisol
Bought by
Cepeda Nelson
Purchase Details
Closed on
May 1, 1990
Sold by
Berrios Aida
Bought by
Olavarria Reynaldo
Create a Home Valuation Report for This Property
The Home Valuation Report is an in-depth analysis detailing your home's value as well as a comparison with similar homes in the area
Home Values in the Area
Average Home Value in this Area
Purchase History
| Date | Buyer | Sale Price | Title Company |
|---|---|---|---|
| Williams Clint | $110,000 | -- | |
| Williams Clint | $110,000 | -- | |
| Socarate Enrique | $55,000 | -- | |
| Socarate Enrique | $55,000 | -- | |
| Federal National Mortgage Association | -- | -- | |
| Federal National Mortgage Association | -- | -- | |
| Chase Home Finance | -- | -- | |
| Chase Home Finance | -- | -- | |
| Berroa John | $290,000 | -- | |
| Berroa John | $290,000 | -- | |
| Cepeda Nelson | $167,000 | -- | |
| Cepeda Nelson | $167,000 | -- | |
| Olavarria Reynaldo | $137,000 | -- |
Source: Public Records
Mortgage History
| Date | Status | Borrower | Loan Amount |
|---|---|---|---|
| Open | Olavarria Reynaldo | $175,000 | |
| Closed | Olavarria Reynaldo | $82,500 |
Source: Public Records
Tax History Compared to Growth
Tax History
| Year | Tax Paid | Tax Assessment Tax Assessment Total Assessment is a certain percentage of the fair market value that is determined by local assessors to be the total taxable value of land and additions on the property. | Land | Improvement |
|---|---|---|---|---|
| 2025 | $6,415 | $147,650 | $29,310 | $118,340 |
| 2024 | $6,415 | $147,650 | $29,310 | $118,340 |
| 2023 | $6,415 | $147,650 | $29,310 | $118,340 |
| 2022 | $6,415 | $147,650 | $29,310 | $118,340 |
| 2021 | $6,415 | $147,650 | $29,310 | $118,340 |
| 2020 | $6,131 | $113,560 | $16,400 | $97,160 |
| 2019 | $6,131 | $113,560 | $16,400 | $97,160 |
| 2018 | $6,174 | $113,560 | $16,400 | $97,160 |
| 2017 | $6,174 | $113,560 | $16,400 | $97,160 |
| 2016 | $6,174 | $113,560 | $16,400 | $97,160 |
| 2015 | $6,801 | $161,170 | $28,120 | $133,050 |
| 2014 | $6,801 | $161,170 | $28,120 | $133,050 |
Source: Public Records
Map
Nearby Homes
- 179 Read St
- 1034 Connecticut Ave
- 68 Edwin St Unit 70
- 1440 Stratford Ave
- 557 Wilmot #6 Ave
- 306 Carroll Ave
- 363 Carroll Ave Unit 365
- 785 Connecticut Ave Unit 2
- 580 Wilmot Ave Unit 2
- 610 Wilmot Ave Unit 4
- 591 Wilmot Ave Unit 3
- 408 Union Ave
- 566 Wilmot Ave Unit 4
- 320 Union Ave
- 819 Connecticut Ave Unit 6
- 49 Bunnell St Unit 51
- 221 Bunnell St
- 54 6th St
- 643 Newfield Ave Unit 645
- 1189 Central Ave
- 199 Read St Unit 201
- 201 Read St Unit 1
- 201 Read St Unit 1ST.
- 191 Read St
- 207 Read St
- 217 Read St
- 215 Read St
- 215 Read St Unit 3
- 215 Read St Unit 1
- 183 Read St
- 196 Read St
- 294 Davenport St
- 204 Read St
- 190 Read St
- 288 Davenport St Unit 290
- 280 Davenport St Unit 282
- 216 Read St
- 177 Read St Unit 2ND
- 177 Read St Unit 3
- 177 Read St Unit 2