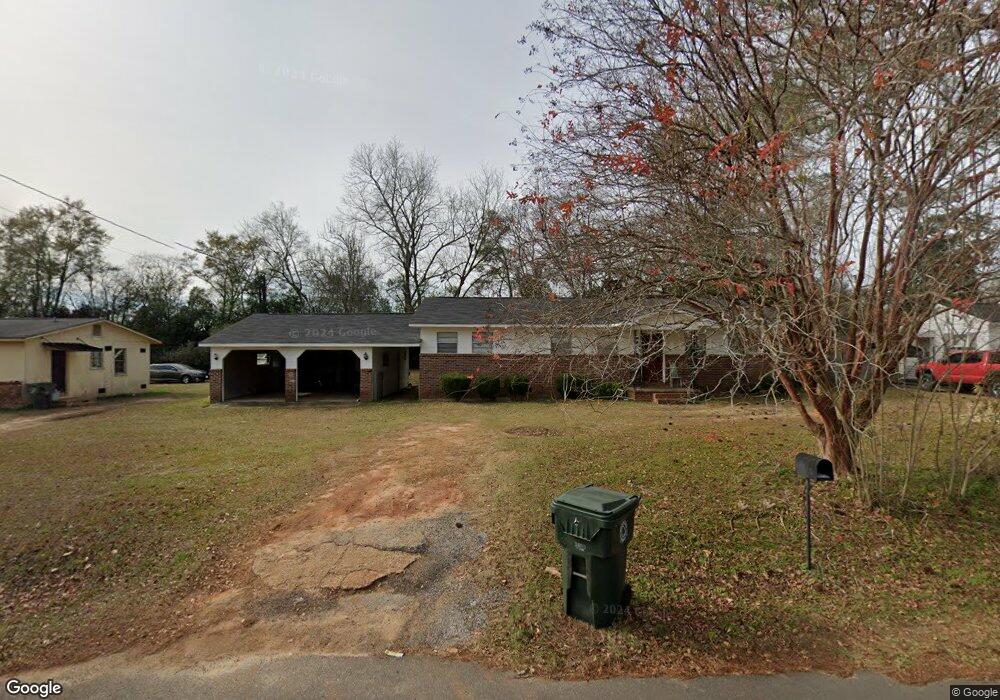
199 Redbud St Blakely, GA 39823
Estimated Value: $88,000 - $95,000
Studio
1
Bath
1,266
Sq Ft
$73/Sq Ft
Est. Value
About This Home
This home is located at 199 Redbud St, Blakely, GA 39823 and is currently estimated at $92,213, approximately $72 per square foot. 199 Redbud St is a home located in Early County with nearby schools including Early County Elementary School, Early County Middle School, and Early County High School.
Ownership History
Date
Name
Owned For
Owner Type
Purchase Details
Closed on
Dec 4, 2019
Sold by
Payton Kenneth R
Bought by
Smith Brothers Real Estate Investments L
Current Estimated Value
Home Financials for this Owner
Home Financials are based on the most recent Mortgage that was taken out on this home.
Original Mortgage
$45,000
Outstanding Balance
$25,970
Interest Rate
3.6%
Mortgage Type
New Conventional
Estimated Equity
$66,243
Purchase Details
Closed on
Jan 30, 1998
Sold by
Bryant Bryant N and Bryant Bett
Bought by
Payton Kenneth R
Purchase Details
Closed on
Mar 18, 1991
Bought by
Bryant Bryant N and Bryant Bett
Purchase Details
Closed on
Jan 14, 1991
Sold by
Wise Joseph R and Wise Dale
Bought by
Federal National Mortgage Assoc
Purchase Details
Closed on
Feb 21, 1986
Sold by
Stephens Tom W
Bought by
Wise Joseph R and Wise Dale
Purchase Details
Closed on
Sep 16, 1985
Sold by
Stephens Tom
Bought by
Stephens Tom W
Create a Home Valuation Report for This Property
The Home Valuation Report is an in-depth analysis detailing your home's value as well as a comparison with similar homes in the area
Home Values in the Area
Average Home Value in this Area
Purchase History
| Date | Buyer | Sale Price | Title Company |
|---|---|---|---|
| Smith Brothers Real Estate Investments L | $45,000 | -- | |
| Payton Kenneth R | $36,500 | -- | |
| Bryant Bryant N | $23,900 | -- | |
| Federal National Mortgage Assoc | -- | -- | |
| Wise Joseph R | $27,000 | -- | |
| Stephens Tom W | $5,600 | -- |
Source: Public Records
Mortgage History
| Date | Status | Borrower | Loan Amount |
|---|---|---|---|
| Open | Smith Brothers Real Estate Investments L | $45,000 |
Source: Public Records
Tax History
| Year | Tax Paid | Tax Assessment Tax Assessment Total Assessment is a certain percentage of the fair market value that is determined by local assessors to be the total taxable value of land and additions on the property. | Land | Improvement |
|---|---|---|---|---|
| 2025 | $1,223 | $36,624 | $2,400 | $34,224 |
| 2024 | $857 | $27,737 | $2,400 | $25,337 |
| 2023 | $823 | $27,737 | $2,400 | $25,337 |
| 2022 | $669 | $26,539 | $2,400 | $24,139 |
| 2021 | $594 | $23,343 | $2,400 | $20,943 |
| 2020 | $583 | $23,343 | $2,400 | $20,943 |
| 2019 | $646 | $25,127 | $2,400 | $22,727 |
| 2018 | $753 | $25,127 | $2,400 | $22,727 |
| 2017 | $754 | $25,127 | $2,400 | $22,727 |
| 2016 | $702 | $23,472 | $2,400 | $21,072 |
| 2015 | -- | $22,945 | $2,400 | $20,545 |
| 2014 | -- | $22,945 | $2,400 | $20,545 |
| 2013 | -- | $23,261 | $2,400 | $20,861 |
Source: Public Records
Map
Nearby Homes
- 829 Flowers Dr
- 73 Grove Place
- 8 Lots Unknown Ln
- 556 Flowers Dr
- 337 College St
- 439 S Flowers Dr
- 76 S Jefferson Ave
- 0 Dasaree Ln Unit 10683861
- 00 Garden Dr
- 600 Chattahoochee Ave
- 2019 S Main St
- 96 Jesse Johnson Dr
- 93 Arnall Blvd
- 1827 Tarver Dr
- 187 Evergreen Ave
- 0000 Martin Luther King Junior Blvd
- 21 E Railroad Ln
- 74 S Lancelot St
- 115 S Central Ave
- 507 Lakewood Dr
Your Personal Tour Guide
Ask me questions while you tour the home.