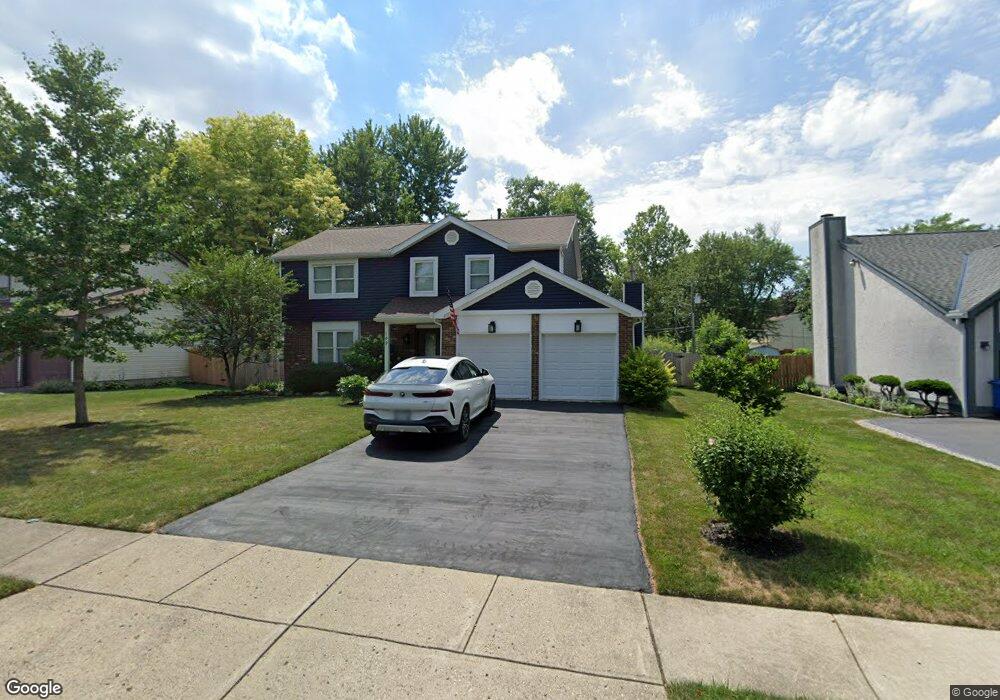
199 Rugby Ln Columbus, OH 43230
Estimated Value: $352,000 - $446,000
4
Beds
3
Baths
1,950
Sq Ft
$208/Sq Ft
Est. Value
About This Home
This home is located at 199 Rugby Ln, Columbus, OH 43230 and is currently estimated at $406,498, approximately $208 per square foot. 199 Rugby Ln is a home located in Franklin County with nearby schools including Chapelfield Elementary School, Gahanna West Middle School, and Lincoln High School.
Ownership History
Date
Name
Owned For
Owner Type
Purchase Details
Closed on
Jun 7, 2007
Sold by
Hebert Christopher A and Hebert Sue A
Bought by
Laser Elizabeth A and Laser Steven J
Current Estimated Value
Home Financials for this Owner
Home Financials are based on the most recent Mortgage that was taken out on this home.
Original Mortgage
$124,850
Outstanding Balance
$76,436
Interest Rate
6.2%
Mortgage Type
Purchase Money Mortgage
Estimated Equity
$330,062
Purchase Details
Closed on
May 19, 2003
Sold by
Knave Inc
Bought by
Hebert Christopher P and Hebert Sue A
Home Financials for this Owner
Home Financials are based on the most recent Mortgage that was taken out on this home.
Original Mortgage
$115,000
Interest Rate
4.25%
Mortgage Type
Purchase Money Mortgage
Purchase Details
Closed on
Apr 10, 1986
Bought by
Knave Inc
Purchase Details
Closed on
Apr 1, 1985
Create a Home Valuation Report for This Property
The Home Valuation Report is an in-depth analysis detailing your home's value as well as a comparison with similar homes in the area
Home Values in the Area
Average Home Value in this Area
Purchase History
| Date | Buyer | Sale Price | Title Company |
|---|---|---|---|
| Laser Elizabeth A | $166,500 | Chicago Tit | |
| Hebert Christopher P | $145,700 | Preferred Title | |
| Knave Inc | $210,000 | -- | |
| -- | -- | -- |
Source: Public Records
Mortgage History
| Date | Status | Borrower | Loan Amount |
|---|---|---|---|
| Open | Laser Elizabeth A | $124,850 | |
| Closed | Hebert Christopher P | $115,000 |
Source: Public Records
Tax History Compared to Growth
Tax History
| Year | Tax Paid | Tax Assessment Tax Assessment Total Assessment is a certain percentage of the fair market value that is determined by local assessors to be the total taxable value of land and additions on the property. | Land | Improvement |
|---|---|---|---|---|
| 2024 | $7,695 | $130,620 | $33,110 | $97,510 |
| 2023 | $7,598 | $130,620 | $33,110 | $97,510 |
| 2022 | $5,915 | $79,210 | $16,910 | $62,300 |
| 2021 | $5,721 | $79,210 | $16,910 | $62,300 |
| 2020 | $5,673 | $79,210 | $16,910 | $62,300 |
| 2019 | $4,763 | $66,360 | $14,070 | $52,290 |
| 2018 | $4,339 | $66,360 | $14,070 | $52,290 |
| 2017 | $4,159 | $66,360 | $14,070 | $52,290 |
| 2016 | $3,947 | $54,570 | $11,450 | $43,120 |
| 2015 | $3,950 | $54,570 | $11,450 | $43,120 |
| 2014 | $3,920 | $54,570 | $11,450 | $43,120 |
| 2013 | $1,946 | $54,565 | $11,445 | $43,120 |
Source: Public Records
Map
Nearby Homes
- 404 Foxwood Dr
- 343 Imperial Dr
- 278 Empire Dr
- 3610 N Stygler Rd
- 470 Deerwood Ave E
- 206 Lintner St
- 175 Stonegate Cir
- 600 Agler Rd
- 364 Morgan Ln
- 221 Lincolnshire Rd
- 373 Lyncroft Dr
- 209 Springbrook Place
- 463 Lincolnshire Rd
- 390 Dunbarton Rd
- 642 Ridenour Rd
- 183 Serran Dr
- 219 N Hamilton Rd
- 668 Kenilworth Ct
- 379 Heil Dr
- 427 Amesbury Dr