Estimated Value: $666,000 - $802,000
4
Beds
3
Baths
2,351
Sq Ft
$306/Sq Ft
Est. Value
About This Home
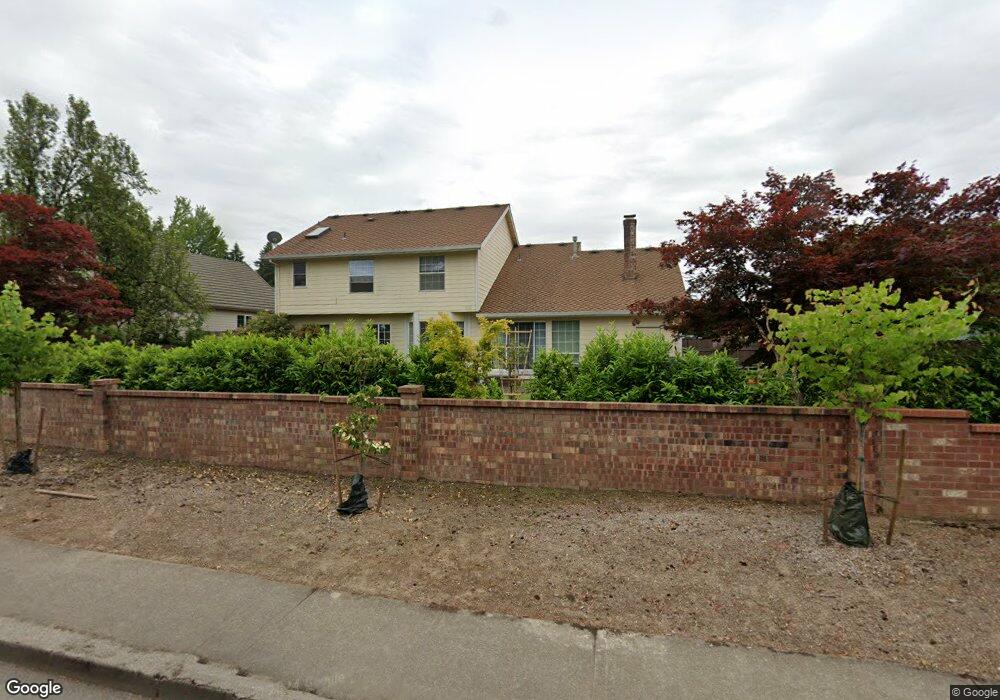
This home is located at 1990 NE 21st Ave, Canby, OR 97013 and is currently estimated at $719,842, approximately $306 per square foot. 1990 NE 21st Ave is a home located in Clackamas County with nearby schools including Josefa L. Sambrano Elementary School, William Knight Elementary School, and Baker Prairie Middle School.
Ownership History
Date
Name
Owned For
Owner Type
Purchase Details
Closed on
Dec 13, 2012
Sold by
Mesher David E and Mesher Kendra D
Bought by
Mcclintock Matthew and Mcclintock Patricia
Current Estimated Value
Home Financials for this Owner
Home Financials are based on the most recent Mortgage that was taken out on this home.
Original Mortgage
$290,714
Outstanding Balance
$199,744
Interest Rate
3.27%
Mortgage Type
New Conventional
Estimated Equity
$520,098
Purchase Details
Closed on
Jun 11, 2003
Sold by
Cendant Mobility Financial Corp
Bought by
Mesher David E and Mesher Kendra D
Home Financials for this Owner
Home Financials are based on the most recent Mortgage that was taken out on this home.
Original Mortgage
$223,150
Interest Rate
5.53%
Mortgage Type
Purchase Money Mortgage
Purchase Details
Closed on
Feb 7, 2003
Sold by
Cummings Christopher J and Cummings Robin M
Bought by
Cendant Mobility Financial Corp
Create a Home Valuation Report for This Property
The Home Valuation Report is an in-depth analysis detailing your home's value as well as a comparison with similar homes in the area
Home Values in the Area
Average Home Value in this Area
Purchase History
| Date | Buyer | Sale Price | Title Company |
|---|---|---|---|
| Mcclintock Matthew | $284,900 | Fidelity Natl Title Co Of Or | |
| Mesher David E | $234,900 | Fatco | |
| Cendant Mobility Financial Corp | $231,167 | First Amer Title Ins Co Of O |
Source: Public Records
Mortgage History
| Date | Status | Borrower | Loan Amount |
|---|---|---|---|
| Open | Mcclintock Matthew | $290,714 | |
| Previous Owner | Mesher David E | $223,150 |
Source: Public Records
Tax History Compared to Growth
Tax History
| Year | Tax Paid | Tax Assessment Tax Assessment Total Assessment is a certain percentage of the fair market value that is determined by local assessors to be the total taxable value of land and additions on the property. | Land | Improvement |
|---|---|---|---|---|
| 2025 | $8,165 | $460,859 | -- | -- |
| 2024 | $7,936 | $447,436 | -- | -- |
| 2023 | $7,936 | $434,404 | $0 | $0 |
| 2022 | $7,299 | $421,752 | $0 | $0 |
| 2021 | $7,029 | $409,468 | $0 | $0 |
| 2020 | $6,903 | $397,542 | $0 | $0 |
| 2019 | $6,574 | $385,964 | $0 | $0 |
| 2018 | $6,427 | $374,722 | $0 | $0 |
| 2017 | $6,264 | $363,808 | $0 | $0 |
| 2016 | $6,055 | $353,212 | $0 | $0 |
| 2015 | $5,847 | $342,924 | $0 | $0 |
| 2014 | $5,679 | $332,936 | $0 | $0 |
Source: Public Records
Map
Nearby Homes
- 1947 NE 21st Ave
- 2125 NE Spitz Rd
- 2123 NE Spitz Rd
- 1552 NE 19th Loop
- 1620 N Sweetgum St
- 1422 NE 18th Place
- 32088 SW Peach Cove Rd
- 1200 NE Territorial Rd Unit 93
- 1009 NE 17th Ave
- 1750 N Oak St
- 878 NE 17th Ave
- 952 NE 17th Ave
- 947 NE 17th Ave
- 1558 NE 10th Place
- 31616 SW Isle Way Ln
- 844 NE 17th Ave
- 838 NE 17th Ave
- 832 NE 17th Ave
- 853 NE 17th Ave
- 860 NE 14th Ave
- 1960 NE 21st Ave
- 2008 NE 21st Ave
- 1983 NE 21st Ave
- 1940 NE 21st Ave
- 2024 NE 21st Ave
- 2033 NE Territorial Rd
- 1962 NE 20th Ave
- 1991 NE 20th Ave
- 1920 NE 21st Ave
- 2121 NE Territorial Rd
- 1911 NE 21st Ave Unit 1
- 1911 NE 21st Ave
- 2105 N Vine St
- 2089 N Vine St
- 1969 NE 20th Ave
- 1938 NE 20th Ave
- 2073 N Vine St
- 1880 NE 21st Ave
- 2057 N Vine St
- 1877 NE 21st Ave