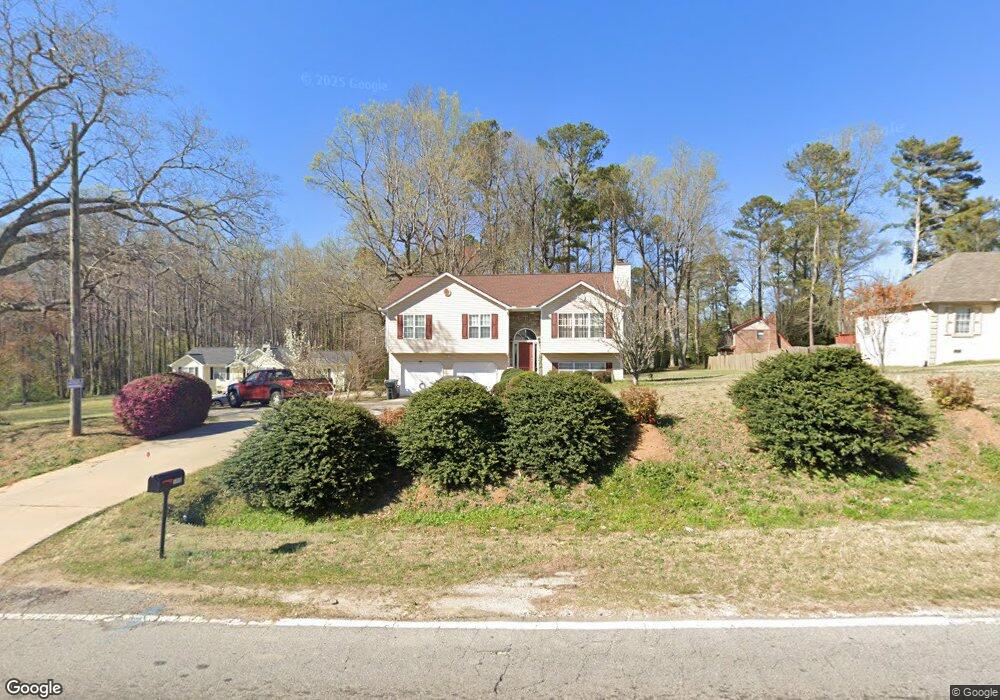
1990 Skyview Dr Lithia Springs, GA 30122
Lithia Springs NeighborhoodEstimated Value: $260,716 - $323,000
3
Beds
2
Baths
1,302
Sq Ft
$220/Sq Ft
Est. Value
About This Home
This home is located at 1990 Skyview Dr, Lithia Springs, GA 30122 and is currently estimated at $286,679, approximately $220 per square foot. 1990 Skyview Dr is a home located in Douglas County with nearby schools including Annette Winn Elementary School, Turner Middle School, and Lithia Springs Comprehensive High School.
Ownership History
Date
Name
Owned For
Owner Type
Purchase Details
Closed on
Jul 13, 2018
Sold by
Ostorga Maria
Bought by
Vasquez Jose
Current Estimated Value
Purchase Details
Closed on
Mar 26, 2004
Sold by
Griffin Tonya S
Bought by
Vasquez Jose
Home Financials for this Owner
Home Financials are based on the most recent Mortgage that was taken out on this home.
Original Mortgage
$142,575
Interest Rate
5.49%
Mortgage Type
VA
Purchase Details
Closed on
Oct 11, 2002
Sold by
Griffin Theron G
Bought by
Griffin Tonya S
Purchase Details
Closed on
Aug 15, 1997
Sold by
Hamlin Constr
Bought by
Griffin Tonya S
Home Financials for this Owner
Home Financials are based on the most recent Mortgage that was taken out on this home.
Original Mortgage
$95,800
Interest Rate
11.5%
Mortgage Type
New Conventional
Purchase Details
Closed on
Dec 11, 1996
Sold by
Davis Keith
Bought by
Hamlin Constr
Purchase Details
Closed on
Feb 8, 1996
Sold by
Estes David
Bought by
Davis Keith
Purchase Details
Closed on
Dec 21, 1995
Sold by
Casey Daniel Dorothy
Bought by
Estes David
Create a Home Valuation Report for This Property
The Home Valuation Report is an in-depth analysis detailing your home's value as well as a comparison with similar homes in the area
Home Values in the Area
Average Home Value in this Area
Purchase History
| Date | Buyer | Sale Price | Title Company |
|---|---|---|---|
| Vasquez Jose | -- | -- | |
| Vasquez Jose | $144,900 | -- | |
| Griffin Tonya S | -- | -- | |
| Griffin Tonya S | $119,800 | -- | |
| Hamlin Constr | $16,000 | -- | |
| Davis Keith | $15,000 | -- | |
| Estes David | $12,500 | -- |
Source: Public Records
Mortgage History
| Date | Status | Borrower | Loan Amount |
|---|---|---|---|
| Previous Owner | Vasquez Jose | $142,575 | |
| Previous Owner | Griffin Tonya S | $95,800 | |
| Closed | Hamlin Constr | $0 |
Source: Public Records
Tax History Compared to Growth
Tax History
| Year | Tax Paid | Tax Assessment Tax Assessment Total Assessment is a certain percentage of the fair market value that is determined by local assessors to be the total taxable value of land and additions on the property. | Land | Improvement |
|---|---|---|---|---|
| 2024 | $2,094 | $66,560 | $16,000 | $50,560 |
| 2023 | $2,094 | $66,560 | $16,000 | $50,560 |
| 2022 | $2,167 | $66,560 | $16,000 | $50,560 |
| 2021 | $1,875 | $57,480 | $16,640 | $40,840 |
| 2020 | $1,500 | $45,240 | $9,880 | $35,360 |
| 2019 | $1,372 | $44,320 | $9,880 | $34,440 |
| 2018 | $1,187 | $38,160 | $8,800 | $29,360 |
| 2017 | $1,101 | $34,720 | $8,800 | $25,920 |
| 2016 | $1,091 | $33,800 | $8,800 | $25,000 |
| 2015 | $1,077 | $32,680 | $8,800 | $23,880 |
| 2014 | $1,022 | $30,400 | $8,800 | $21,600 |
| 2013 | -- | $37,960 | $11,000 | $26,960 |
Source: Public Records
Map
Nearby Homes
- 2019 Dutchess Rd
- 6889 Kingsboro Dr Unit 2
- 2948 Windsor Dr
- 542 Hasty Dr
- 859 Aspen Dr
- 7306 Mount Vernon Rd
- 2790 Deerfield Dr
- 3245 W Anderson Dr
- 3138 Beechwood Dr
- 3340 Skyview Dr
- 3347 Skyview Dr
- 6560 Bowden St
- 7368 Mount Vernon Rd
- 3403 Linda Dr
- 0 Lakeside Dr Unit 7667066
- Heron Cottage Plan at Paces Estates
- Brookpark Plan at Paces Estates
- Inwood Plan at Paces Estates
- Lakewood Plan at Paces Estates
- 6557 Hill St
- 763 Brannon Dr
- 2006 Skyview Dr
- 755 Brannon Dr
- 750 Brannon Dr
- 1991 Brannon Way
- 2973 Skyview Dr
- 729 Brannon Dr
- 756 Brannon Dr
- 2001 Brannon Way
- 1954 Skyview Dr
- 1960 Skyview Dr
- 740 Brannon Dr
- 0 Brannon Way Unit 7135037
- 0 Brannon Way Unit 8804672
- 0 Brannon Way Unit 8394629
- 0 Brannon Way Unit 3173314
- 0 Brannon Way Unit 7039978
- 0 Brannon Way Unit 8120151
- 0 Brannon Way Unit 8270218
- 0 Brannon Way Unit 8399351