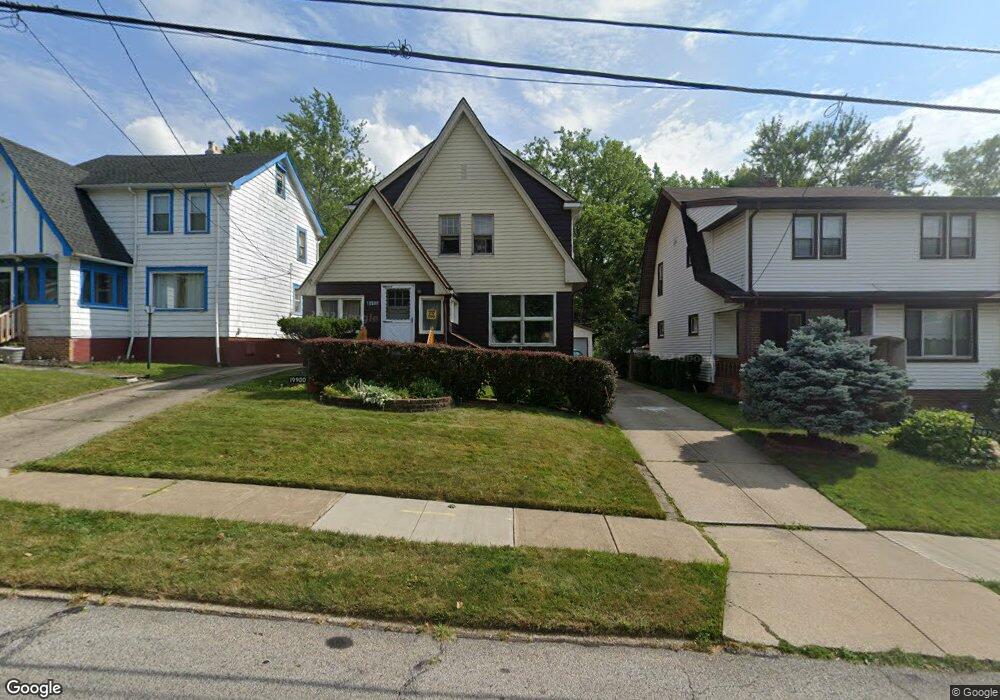
19900 Raymond St Maple Heights, OH 44137
Estimated Value: $121,771 - $140,000
4
Beds
1
Bath
1,498
Sq Ft
$86/Sq Ft
Est. Value
About This Home
This home is located at 19900 Raymond St, Maple Heights, OH 44137 and is currently estimated at $129,193, approximately $86 per square foot. 19900 Raymond St is a home located in Cuyahoga County with nearby schools including Abraham Lincoln Elementary School, Rockside/ J.F. Kennedy School, and Italy High School.
Ownership History
Date
Name
Owned For
Owner Type
Purchase Details
Closed on
Dec 13, 2002
Sold by
Reed Ronald
Bought by
Reed Ronald and Reed Valerie D
Current Estimated Value
Home Financials for this Owner
Home Financials are based on the most recent Mortgage that was taken out on this home.
Original Mortgage
$66,300
Interest Rate
6.25%
Purchase Details
Closed on
Jun 17, 1998
Sold by
Fcms Reo Sub Corp
Bought by
Reed Ronald
Home Financials for this Owner
Home Financials are based on the most recent Mortgage that was taken out on this home.
Original Mortgage
$56,050
Interest Rate
7.03%
Purchase Details
Closed on
Jul 2, 1997
Sold by
Sheriff Of Cuyahoga Coun
Bought by
Fairbanks Capital Corp
Purchase Details
Closed on
Jun 14, 1985
Sold by
Shoop Timothy A
Bought by
Shoop Nancy A
Purchase Details
Closed on
May 31, 1983
Sold by
Lindsay James and Lindsay Jean E
Bought by
Shoop Timothy A
Purchase Details
Closed on
Jan 1, 1975
Bought by
Lindsay James and Lindsay Jean E
Create a Home Valuation Report for This Property
The Home Valuation Report is an in-depth analysis detailing your home's value as well as a comparison with similar homes in the area
Home Values in the Area
Average Home Value in this Area
Purchase History
| Date | Buyer | Sale Price | Title Company |
|---|---|---|---|
| Reed Ronald | -- | Barristers Title Agency | |
| Reed Ronald | $59,000 | National Title | |
| Fairbanks Capital Corp | $39,334 | -- | |
| Shoop Nancy A | -- | -- | |
| Kibler Gerald G | $51,000 | -- | |
| Shoop Timothy A | $42,900 | -- | |
| Lindsay James | -- | -- |
Source: Public Records
Mortgage History
| Date | Status | Borrower | Loan Amount |
|---|---|---|---|
| Closed | Reed Ronald | $66,300 | |
| Previous Owner | Reed Ronald | $56,050 |
Source: Public Records
Tax History Compared to Growth
Tax History
| Year | Tax Paid | Tax Assessment Tax Assessment Total Assessment is a certain percentage of the fair market value that is determined by local assessors to be the total taxable value of land and additions on the property. | Land | Improvement |
|---|---|---|---|---|
| 2024 | $3,668 | $41,335 | $6,720 | $34,615 |
| 2023 | $2,333 | $21,780 | $3,890 | $17,890 |
| 2022 | $2,325 | $21,770 | $3,890 | $17,890 |
| 2021 | $2,477 | $21,770 | $3,890 | $17,890 |
| 2020 | $2,117 | $16,490 | $2,940 | $13,550 |
| 2019 | $2,105 | $47,100 | $8,400 | $38,700 |
| 2018 | $1,977 | $16,490 | $2,940 | $13,550 |
| 2017 | $2,010 | $14,950 | $2,700 | $12,250 |
| 2016 | $1,945 | $14,950 | $2,700 | $12,250 |
| 2015 | $1,943 | $14,950 | $2,700 | $12,250 |
| 2014 | $1,943 | $16,420 | $2,980 | $13,440 |
Source: Public Records
Map
Nearby Homes
- 20120 Mccracken Rd
- 19807 Gardenview Dr
- 19309 Nitra Ave
- 19520 Maple Heights Blvd
- 20715 Watson Rd
- 19806 Mountville Dr
- 5165 Camden Rd
- 20107 Libby Rd
- 20814 Watson Rd
- 20510 Mountville Dr
- 20907 Watson Rd
- 20701 Kenyon Dr
- 19812 Stockton Ave
- 21102 Raymond St
- 20814 Kenyon Dr
- 19289 Stafford Ave
- 21207 Franklin Rd
- 5265 Bellview St
- 19221 Stafford Ave
- 18909 Maple Heights Blvd
- 19966 Raymond St
- 19870 Raymond St
- 19970 Raymond St
- 19850 Raymond St
- 19830 Raymond St
- 19810 Maple Heights Blvd
- 19976 Raymond St
- 19925 Raymond St
- 19941 Raymond St
- 19931 Raymond St
- 19979 Raymond St
- 20002 Raymond St
- 19981 Raymond St
- 20008 Raymond St
- 20001 Raymond St
- 20040 Raymond St
- 19819 Maple Heights Blvd
- 20021 Raymond St
- 19815 Maple Heights Blvd
- 19823 Maple Heights Blvd