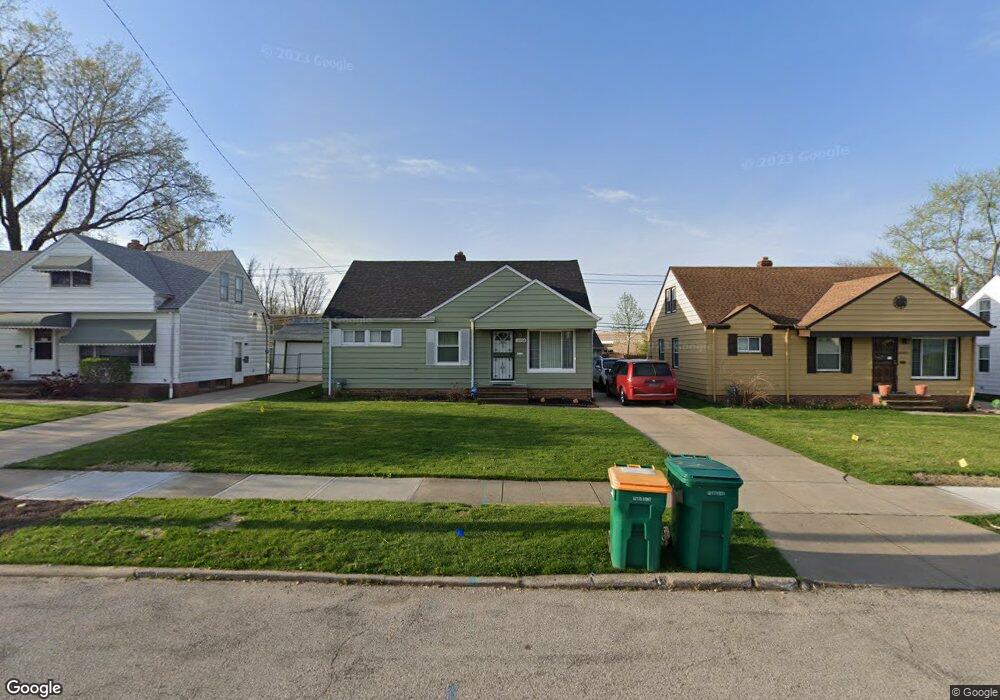
19908 Stockton Ave Maple Heights, OH 44137
Estimated Value: $124,000 - $159,000
3
Beds
1
Bath
1,401
Sq Ft
$98/Sq Ft
Est. Value
About This Home
This home is located at 19908 Stockton Ave, Maple Heights, OH 44137 and is currently estimated at $137,077, approximately $97 per square foot. 19908 Stockton Ave is a home located in Cuyahoga County with nearby schools including Abraham Lincoln Elementary School, Rockside/ J.F. Kennedy School, and Italy High School.
Ownership History
Date
Name
Owned For
Owner Type
Purchase Details
Closed on
Nov 6, 2003
Sold by
Jones Dennis D
Bought by
Hardy Conicia S
Current Estimated Value
Home Financials for this Owner
Home Financials are based on the most recent Mortgage that was taken out on this home.
Original Mortgage
$91,650
Outstanding Balance
$42,548
Interest Rate
6.02%
Mortgage Type
Purchase Money Mortgage
Estimated Equity
$94,529
Purchase Details
Closed on
May 24, 2001
Sold by
Jones Dennis D
Bought by
Jones Dennis D
Purchase Details
Closed on
Nov 28, 1986
Sold by
Douglas Jones
Bought by
Jones Dennis D and Jones Mary
Purchase Details
Closed on
Apr 12, 1979
Sold by
Jones Douglas O and Jones Elsie Z
Bought by
Douglas Jones
Purchase Details
Closed on
Jan 1, 1975
Bought by
Jones Douglas O and Jones Elsie Z
Create a Home Valuation Report for This Property
The Home Valuation Report is an in-depth analysis detailing your home's value as well as a comparison with similar homes in the area
Home Values in the Area
Average Home Value in this Area
Purchase History
| Date | Buyer | Sale Price | Title Company |
|---|---|---|---|
| Hardy Conicia S | $96,500 | Beachwood Title Inc | |
| Jones Dennis D | -- | -- | |
| Jones Dennis D | $50,000 | -- | |
| Douglas Jones | -- | -- | |
| Jones Douglas O | -- | -- |
Source: Public Records
Mortgage History
| Date | Status | Borrower | Loan Amount |
|---|---|---|---|
| Open | Hardy Conicia S | $91,650 |
Source: Public Records
Tax History Compared to Growth
Tax History
| Year | Tax Paid | Tax Assessment Tax Assessment Total Assessment is a certain percentage of the fair market value that is determined by local assessors to be the total taxable value of land and additions on the property. | Land | Improvement |
|---|---|---|---|---|
| 2024 | $3,756 | $42,000 | $7,070 | $34,930 |
| 2023 | $2,902 | $27,720 | $5,040 | $22,680 |
| 2022 | $2,892 | $27,720 | $5,040 | $22,680 |
| 2021 | $3,086 | $27,720 | $5,040 | $22,680 |
| 2020 | $2,629 | $21,000 | $3,820 | $17,190 |
| 2019 | $2,615 | $60,000 | $10,900 | $49,100 |
| 2018 | $2,492 | $21,000 | $3,820 | $17,190 |
| 2017 | $2,565 | $20,200 | $4,970 | $15,230 |
| 2016 | $2,480 | $20,200 | $4,970 | $15,230 |
| 2015 | $2,493 | $20,200 | $4,970 | $15,230 |
| 2014 | $2,493 | $22,190 | $5,460 | $16,730 |
Source: Public Records
Map
Nearby Homes
- 19812 Stockton Ave
- 19289 Stafford Ave
- 19806 Mountville Dr
- 20107 Libby Rd
- 19807 Gardenview Dr
- 19520 Maple Heights Blvd
- 20510 Mountville Dr
- 19221 Stafford Ave
- 20701 Kenyon Dr
- 18909 Maple Heights Blvd
- 5265 Bellview St
- 5165 Camden Rd
- 20625 Centuryway Rd
- 20814 Kenyon Dr
- 5409 Hollywood Ave
- 19309 Nitra Ave
- 5357 Beechwood Ave
- 5571 Oakwood Ave
- 20120 Mccracken Rd
- 20814 Watson Rd
- 19912 Stockton Ave
- 19904 Stockton Ave
- 19916 Stockton Ave
- 19900 Stockton Ave
- 19820 Stockton Ave
- 20000 Stockton Ave
- 19909 Stockton Ave
- 19913 Stockton Ave
- 19905 Stockton Ave
- 19901 Stockton 3 4fr
- 19901 Stockton Ave
- 19917 Stockton Ave
- 20004 Stockton Ave
- 19821 Stockton Ave
- 20001 Stockton Ave
- 19817 Stockton Ave
- 20005 Stockton Ave
- 19916 Libby Rd
- 20000 Libby Rd
- 19912 Libby Rd