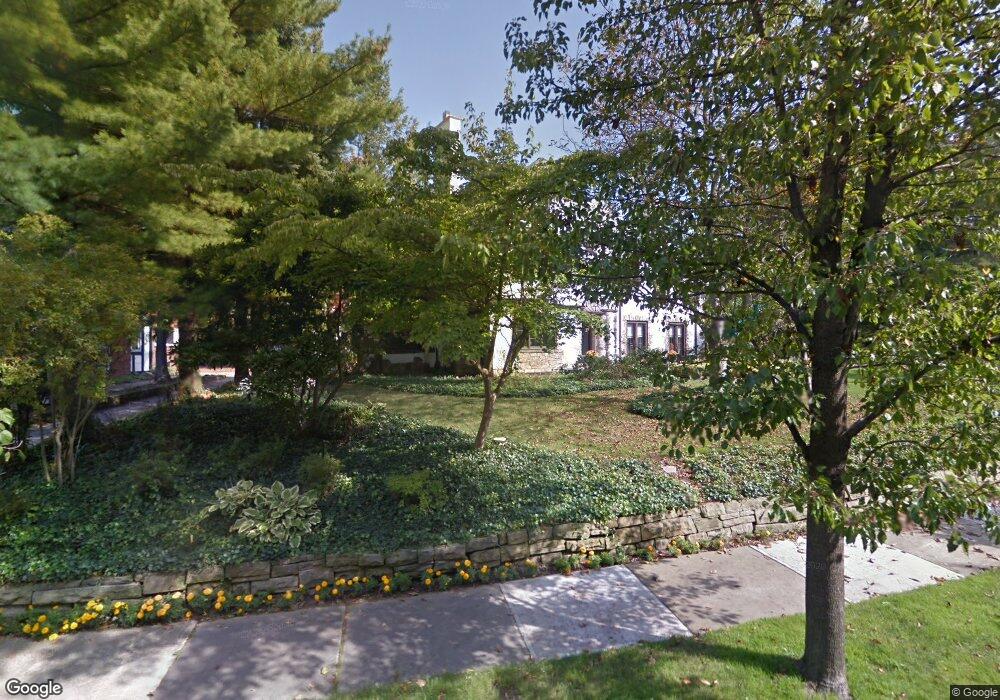
19909 Marchmont Rd Shaker Heights, OH 44122
Estimated Value: $706,000 - $897,000
4
Beds
4
Baths
3,868
Sq Ft
$211/Sq Ft
Est. Value
About This Home
This home is located at 19909 Marchmont Rd, Shaker Heights, OH 44122 and is currently estimated at $814,662, approximately $210 per square foot. 19909 Marchmont Rd is a home located in Cuyahoga County with nearby schools including Onaway Elementary School, Woodbury Elementary School, and Shaker Heights Middle School.
Ownership History
Date
Name
Owned For
Owner Type
Purchase Details
Closed on
Apr 30, 2007
Sold by
Siegel John H and Siegel Mary E
Bought by
Weingart Michael and Weingart Heather
Current Estimated Value
Home Financials for this Owner
Home Financials are based on the most recent Mortgage that was taken out on this home.
Original Mortgage
$50,000
Outstanding Balance
$30,480
Interest Rate
6.21%
Mortgage Type
Stand Alone Second
Estimated Equity
$784,182
Purchase Details
Closed on
Sep 13, 2005
Sold by
Tartakoff Alan M and Tartak Laura Y
Bought by
Siegel John H and Siegel Mary E
Home Financials for this Owner
Home Financials are based on the most recent Mortgage that was taken out on this home.
Original Mortgage
$412,000
Interest Rate
5.93%
Mortgage Type
Fannie Mae Freddie Mac
Purchase Details
Closed on
Aug 11, 1983
Sold by
Abrams Howard S and Abrams Carol K
Bought by
Tartakoff Alan M
Purchase Details
Closed on
Aug 5, 1975
Sold by
Christensen Craig W and Christensen Joan K
Bought by
Abrams Howard S and Abrams Carol K
Purchase Details
Closed on
Jan 1, 1975
Bought by
Christensen Craig W and Christensen Joan K
Create a Home Valuation Report for This Property
The Home Valuation Report is an in-depth analysis detailing your home's value as well as a comparison with similar homes in the area
Home Values in the Area
Average Home Value in this Area
Purchase History
| Date | Buyer | Sale Price | Title Company |
|---|---|---|---|
| Weingart Michael | $571,000 | Real Living Title Agency L | |
| Siegel John H | $515,000 | Executive Title Agency | |
| Tartakoff Alan M | $215,100 | -- | |
| Abrams Howard S | $100,000 | -- | |
| Christensen Craig W | -- | -- |
Source: Public Records
Mortgage History
| Date | Status | Borrower | Loan Amount |
|---|---|---|---|
| Open | Weingart Michael | $50,000 | |
| Open | Weingart Michael | $417,000 | |
| Previous Owner | Siegel John H | $412,000 |
Source: Public Records
Tax History Compared to Growth
Tax History
| Year | Tax Paid | Tax Assessment Tax Assessment Total Assessment is a certain percentage of the fair market value that is determined by local assessors to be the total taxable value of land and additions on the property. | Land | Improvement |
|---|---|---|---|---|
| 2024 | $23,128 | $258,265 | $41,825 | $216,440 |
| 2023 | $23,473 | $208,150 | $39,030 | $169,120 |
| 2022 | $22,820 | $208,150 | $39,030 | $169,120 |
| 2021 | $22,742 | $208,150 | $39,030 | $169,120 |
| 2020 | $23,677 | $204,050 | $38,260 | $165,800 |
| 2019 | $23,306 | $583,000 | $109,300 | $473,700 |
| 2018 | $22,968 | $204,050 | $38,260 | $165,800 |
| 2017 | $23,438 | $194,080 | $31,360 | $162,720 |
| 2016 | $22,529 | $194,080 | $31,360 | $162,720 |
| 2015 | $21,978 | $194,080 | $31,360 | $162,720 |
| 2014 | $21,978 | $183,090 | $29,580 | $153,510 |
Source: Public Records
Map
Nearby Homes
- 3279 Warrensville Center Rd Unit 3 A
- 3279 Warrensville Center Rd Unit 15D
- 3133 Somerset Dr
- 19200 S Woodland Rd
- 3180 Somerset Dr
- 19901 Van Aken Blvd Unit C-106
- 19901 Van Aken Blvd Unit 205C
- 19901 Van Aken Blvd Unit 7
- 19201 Van Aken Blvd Unit 211
- 19201 Van Aken Blvd Unit 114
- 19201 Van Aken Blvd Unit 510
- 19201 Van Aken Blvd Unit 513
- 19101 Van Aken Blvd Unit 219
- 20975 Farnsleigh Rd
- 19436 Van Aken Blvd Unit 205
- 19015 Van Aken Blvd Unit 516
- 19627 Winslow Rd
- 18975 Van Aken Blvd Unit 401
- 18975 Van Aken Blvd Unit 407
- 19229 Winslow Rd
- 3176 Falmouth Rd
- 19815 Marchmont Rd
- 3158 Falmouth Rd
- 3175 Montgomery Rd
- 3199 Falmouth Rd
- 3175 Falmouth Rd
- 3157 Montgomery Rd
- 3140 Falmouth Rd
- 3157 Falmouth Rd
- 19900 Marchmont Rd
- 19850 Marchmont Rd
- 20000 Marchmont Rd
- 3139 Montgomery Rd
- 3139 Falmouth Rd
- 3120 Falmouth Rd
- 3200 Morley Rd
- 20010 Marchmont Rd
- 19800 Marchmont Rd
- 3176 Morley Rd
- 3119 Montgomery Rd