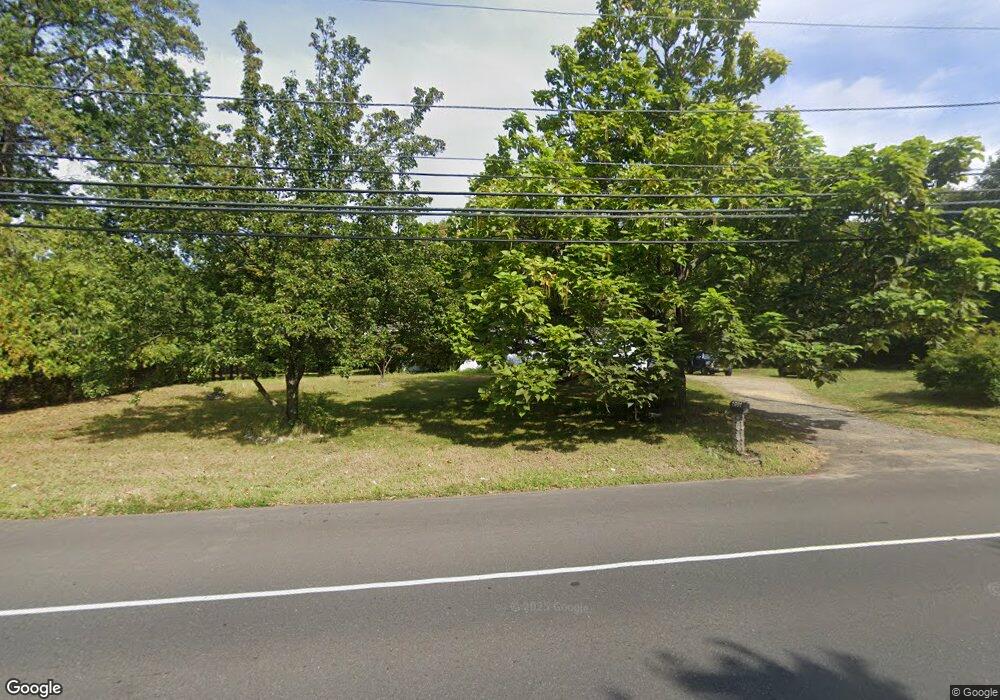
1991 Wayside Rd Eatontown, NJ 07724
Estimated Value: $523,000 - $755,000
2
Beds
1
Bath
720
Sq Ft
$837/Sq Ft
Est. Value
About This Home
This home is located at 1991 Wayside Rd, Eatontown, NJ 07724 and is currently estimated at $602,920, approximately $837 per square foot. 1991 Wayside Rd is a home located in Monmouth County with nearby schools including Mahala F. Atchinson Elementary School, Swimming River Elementary School, and Tinton Falls Middle School.
Ownership History
Date
Name
Owned For
Owner Type
Purchase Details
Closed on
Sep 26, 2011
Sold by
Christopher Rumph Llc
Bought by
Wahler Keith and Wahler Debra
Current Estimated Value
Home Financials for this Owner
Home Financials are based on the most recent Mortgage that was taken out on this home.
Original Mortgage
$128,000
Outstanding Balance
$86,921
Interest Rate
4.01%
Mortgage Type
New Conventional
Estimated Equity
$515,999
Purchase Details
Closed on
May 6, 2011
Sold by
Benson James
Bought by
Christopher Rumph Llc
Create a Home Valuation Report for This Property
The Home Valuation Report is an in-depth analysis detailing your home's value as well as a comparison with similar homes in the area
Home Values in the Area
Average Home Value in this Area
Purchase History
| Date | Buyer | Sale Price | Title Company |
|---|---|---|---|
| Wahler Keith | $160,000 | Multiple | |
| Christopher Rumph Llc | $85,000 | Chicago Title Insurance Co |
Source: Public Records
Mortgage History
| Date | Status | Borrower | Loan Amount |
|---|---|---|---|
| Open | Wahler Keith | $128,000 |
Source: Public Records
Tax History Compared to Growth
Tax History
| Year | Tax Paid | Tax Assessment Tax Assessment Total Assessment is a certain percentage of the fair market value that is determined by local assessors to be the total taxable value of land and additions on the property. | Land | Improvement |
|---|---|---|---|---|
| 2025 | $6,499 | $525,200 | $388,100 | $137,100 |
| 2024 | $6,131 | $451,600 | $305,100 | $146,500 |
| 2023 | $6,131 | $401,800 | $260,100 | $141,700 |
| 2022 | $5,686 | $368,600 | $237,600 | $131,000 |
| 2021 | $5,686 | $295,200 | $189,100 | $106,100 |
| 2020 | $5,570 | $279,200 | $189,100 | $90,100 |
| 2019 | $5,552 | $278,700 | $189,100 | $89,600 |
| 2018 | $5,463 | $273,400 | $193,600 | $79,800 |
| 2017 | $5,612 | $273,900 | $210,100 | $63,800 |
| 2016 | $5,819 | $277,600 | $210,100 | $67,500 |
| 2015 | $5,887 | $284,400 | $225,100 | $59,300 |
| 2014 | $6,014 | $277,900 | $219,000 | $58,900 |
Source: Public Records
Map
Nearby Homes