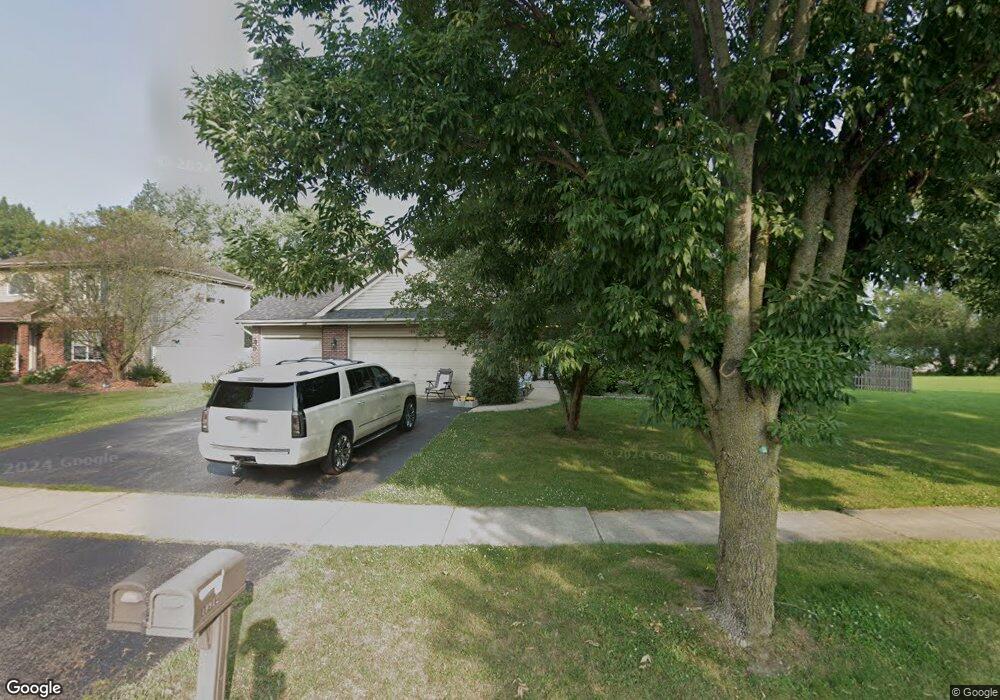
19912 Lakeview Way Mokena, IL 60448
Estimated Value: $436,000 - $503,000
3
Beds
2
Baths
1,997
Sq Ft
$232/Sq Ft
Est. Value
About This Home
This home is located at 19912 Lakeview Way, Mokena, IL 60448 and is currently estimated at $464,113, approximately $232 per square foot. 19912 Lakeview Way is a home located in Will County with nearby schools including Mokena Elementary School, Mokena Intermediate School, and Mokena Jr High School.
Ownership History
Date
Name
Owned For
Owner Type
Purchase Details
Closed on
Aug 11, 2017
Sold by
Kurkowski Mark Edward
Bought by
Hallstrom Lucas D
Current Estimated Value
Home Financials for this Owner
Home Financials are based on the most recent Mortgage that was taken out on this home.
Original Mortgage
$252,700
Outstanding Balance
$215,823
Interest Rate
4.87%
Mortgage Type
New Conventional
Estimated Equity
$248,290
Purchase Details
Closed on
Mar 23, 2017
Sold by
Kurkowski Sarah L
Bought by
Kurkowski Mark Edward
Purchase Details
Closed on
Nov 10, 2000
Sold by
Old Kent Bank
Bought by
Kurkowski Mark E and Kurkowski Sarah L
Home Financials for this Owner
Home Financials are based on the most recent Mortgage that was taken out on this home.
Original Mortgage
$220,348
Interest Rate
7.8%
Mortgage Type
FHA
Create a Home Valuation Report for This Property
The Home Valuation Report is an in-depth analysis detailing your home's value as well as a comparison with similar homes in the area
Home Values in the Area
Average Home Value in this Area
Purchase History
| Date | Buyer | Sale Price | Title Company |
|---|---|---|---|
| Hallstrom Lucas D | $266,000 | Fidelity National Title Ins | |
| Kurkowski Mark Edward | $65,000 | None Available | |
| Kurkowski Mark E | $225,000 | Chicago Title Insurance Co |
Source: Public Records
Mortgage History
| Date | Status | Borrower | Loan Amount |
|---|---|---|---|
| Open | Hallstrom Lucas D | $252,700 | |
| Previous Owner | Kurkowski Mark E | $220,348 |
Source: Public Records
Tax History Compared to Growth
Tax History
| Year | Tax Paid | Tax Assessment Tax Assessment Total Assessment is a certain percentage of the fair market value that is determined by local assessors to be the total taxable value of land and additions on the property. | Land | Improvement |
|---|---|---|---|---|
| 2024 | $10,376 | $135,872 | $34,370 | $101,502 |
| 2023 | $10,376 | $121,347 | $30,696 | $90,651 |
| 2022 | $9,072 | $110,527 | $27,959 | $82,568 |
| 2021 | $8,532 | $103,403 | $26,157 | $77,246 |
| 2020 | $8,330 | $100,489 | $25,420 | $75,069 |
| 2019 | $8,068 | $97,800 | $24,740 | $73,060 |
| 2018 | $7,919 | $94,989 | $24,029 | $70,960 |
| 2017 | $7,911 | $92,772 | $23,468 | $69,304 |
| 2016 | $7,726 | $89,591 | $22,663 | $66,928 |
| 2015 | $7,413 | $86,436 | $21,865 | $64,571 |
| 2014 | $7,413 | $85,835 | $21,713 | $64,122 |
| 2013 | $7,413 | $86,948 | $21,995 | $64,953 |
Source: Public Records
Map
Nearby Homes
- 9860 Stafford Ct
- 10015 Cambridge Dr
- 19758 Sunset Ct
- 20032 Waterview Trail
- 9446 Magnolia Ave
- 20145 Waterview Trail
- 9448 Elm Ave
- 19300 S La Grange Rd
- 9425 Pine St
- 20277 Brendan St
- 9512 Birch Ave
- 20602 Abbey Dr
- 19542 Fiona Ave
- 19525 Fiona Ave
- 10508 W La Porte Rd
- 20659 Abbey Dr
- 8884 Port Washington Dr
- 8964 Port Washington Dr
- 19612 Waterford Ln
- 8844 Port Washington Dr
- 9742 Sorenson Ct
- 19938 Lakeview Way
- 9750 Sorenson Ct
- 19917 Lakeview Way
- 19927 Lakeview Way
- 19901 Lakeview Way
- 19946 Lakeview Way
- 19935 Lakeview Way
- 9751 Sorenson Ct
- 19943 Lakeview Way
- 9758 Sorenson Ct
- 19951 Arbor Ln
- 19896 Lakeview Way
- 19898 Lakeview Way
- 19954 Lakeview Way
- 9801 Sorenson Ct
- 19897 Lakeview Way
- 19892 Lakeview Way
- 19891 Lakeview Way
- 19959 Arbor Ln