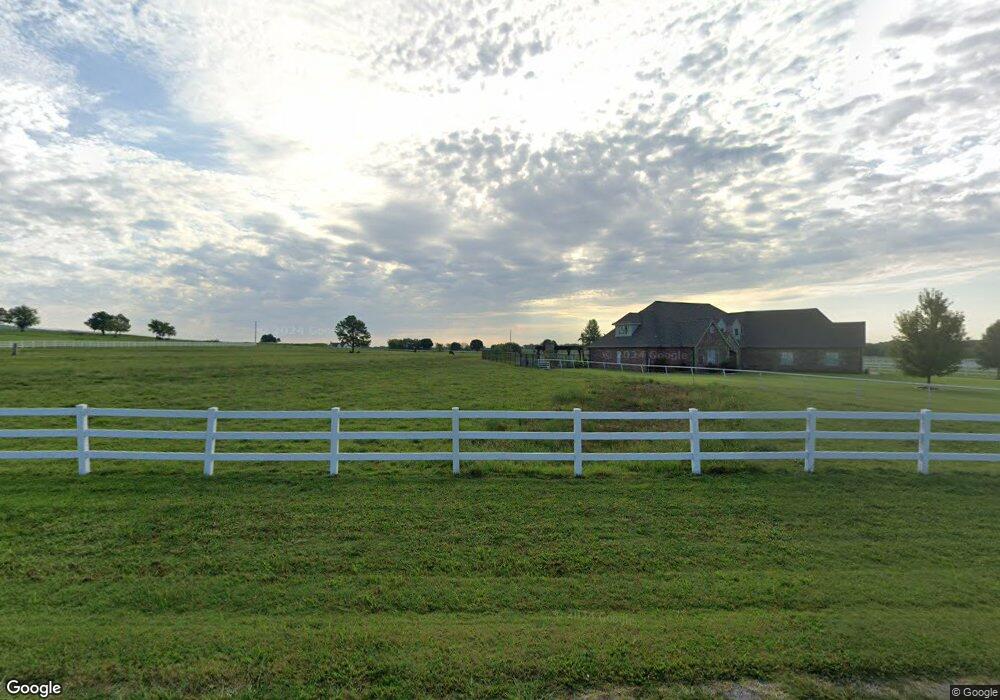
19915 S 43rd West Place Mounds, OK 74047
Estimated Value: $813,947
5
Beds
5
Baths
4,235
Sq Ft
$192/Sq Ft
Est. Value
About This Home
This home is located at 19915 S 43rd West Place, Mounds, OK 74047 and is currently priced at $813,947, approximately $192 per square foot. 19915 S 43rd West Place is a home located in Creek County with nearby schools including Mounds Elementary School and Mounds High School.
Ownership History
Date
Name
Owned For
Owner Type
Purchase Details
Closed on
Nov 2, 2020
Sold by
Powell Clay Deven and Powell Sherri Lynn
Bought by
Powell Clay Deven and Powell Sherri Lynn
Current Estimated Value
Home Financials for this Owner
Home Financials are based on the most recent Mortgage that was taken out on this home.
Original Mortgage
$482,956
Outstanding Balance
$385,521
Interest Rate
2.71%
Mortgage Type
New Conventional
Purchase Details
Closed on
Feb 9, 2015
Sold by
Brooks Bobby N and Brooks Bobby Norwell
Bought by
Powell Clay Deven and Powell Sherri Lynn
Home Financials for this Owner
Home Financials are based on the most recent Mortgage that was taken out on this home.
Original Mortgage
$350,000
Interest Rate
3.78%
Mortgage Type
New Conventional
Create a Home Valuation Report for This Property
The Home Valuation Report is an in-depth analysis detailing your home's value as well as a comparison with similar homes in the area
Home Values in the Area
Average Home Value in this Area
Purchase History
| Date | Buyer | Sale Price | Title Company |
|---|---|---|---|
| Powell Clay Deven | -- | Oklahoma Land Title Svcs Llc | |
| Powell Clay Deven | -- | Oklahoma Land Title Svcs Llc | |
| Powell Clay Deven | $550,000 | None Available |
Source: Public Records
Mortgage History
| Date | Status | Borrower | Loan Amount |
|---|---|---|---|
| Open | Powell Clay Deven | $482,956 | |
| Closed | Powell Clay Deven | $350,000 |
Source: Public Records
Tax History Compared to Growth
Tax History
| Year | Tax Paid | Tax Assessment Tax Assessment Total Assessment is a certain percentage of the fair market value that is determined by local assessors to be the total taxable value of land and additions on the property. | Land | Improvement |
|---|---|---|---|---|
| 2025 | $7,986 | $80,135 | $9,340 | $70,795 |
| 2024 | $7,811 | $77,800 | $8,400 | $69,400 |
| 2023 | $7,811 | $75,535 | $8,400 | $67,135 |
| 2022 | $7,313 | $73,335 | $8,400 | $64,935 |
| 2021 | $7,117 | $72,759 | $8,400 | $64,359 |
| 2020 | $7,176 | $72,759 | $8,400 | $64,359 |
| 2019 | $7,124 | $69,294 | $8,400 | $60,894 |
| 2018 | $6,848 | $65,994 | $8,400 | $57,594 |
| 2017 | $6,694 | $65,994 | $8,400 | $57,594 |
| 2016 | $6,894 | $65,994 | $8,400 | $57,594 |
| 2015 | -- | $57,311 | $9,600 | $47,711 |
| 2014 | -- | $56,583 | $9,600 | $46,983 |
Source: Public Records
Map
Nearby Homes
- 012 W 195th St S
- 07 W 195th St S
- 09 W 195th St S
- 018 W 195th St S
- 020 W 195th St S
- 03 W 195th St S
- 01 S 49th West Ave
- 17624 S 49th West Ave
- 0 Bixby Rd Unit 2538715
- 5406 W 184th St S
- 5393 W 184th St S
- 19405 Carriage Ct
- 495 Hwy 75
- 5757 W 181st St S
- 17822 S 44th West Ave
- 7567 W 191st St S
- 11500 Hectorville Rd
- 11502 Hectorville Rd
- 11100 Hectorville Rd
- 2567 N 250
- 19915 S 43rd Place W
- 19785 S 43rd West Place
- 19785 S 43rd West Place
- 19920 S 43rd West Place
- 4101 W 201st St S
- 4101 W 201st St S Unit South
- 19999 S 43rd West Place
- 19999 S 43rd West Place
- 19790 S 43rd West Place
- 20030 S 43rd West Place
- 19133 S 43 East Ave
- 7047 S 201st West Ave
- 19705 S 43rd West Ave
- 4444 W 201st St S
- 19705 S 43rd West Place
- 4354 W 201st St S
- 19704 S 43rd West Place
- 0 201st St S Unit 524317
- 0 201st St S Unit 1009659
- 0 201st St S Unit 1114042