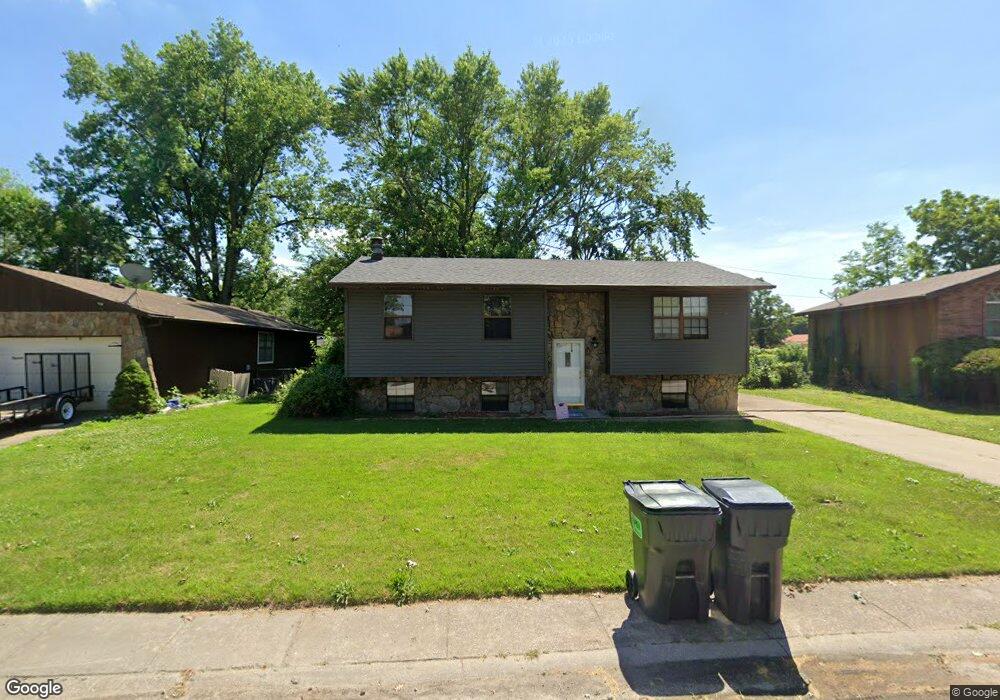
1992 Maple Tree Ln East Saint Louis, IL 62206
Estimated Value: $91,000 - $113,000
--
Bed
--
Bath
960
Sq Ft
$109/Sq Ft
Est. Value
About This Home
This home is located at 1992 Maple Tree Ln, East Saint Louis, IL 62206 and is currently estimated at $104,947, approximately $109 per square foot. 1992 Maple Tree Ln is a home located in St. Clair County.
Ownership History
Date
Name
Owned For
Owner Type
Purchase Details
Closed on
Aug 30, 2006
Sold by
Waddell John and Ogle Abna
Bought by
Dent Tironica
Current Estimated Value
Home Financials for this Owner
Home Financials are based on the most recent Mortgage that was taken out on this home.
Original Mortgage
$91,200
Outstanding Balance
$59,649
Interest Rate
8.37%
Mortgage Type
Purchase Money Mortgage
Estimated Equity
$45,298
Purchase Details
Closed on
Mar 20, 2006
Sold by
Deutsche Bank National Trust Co
Bought by
Waddle John and Ogle Anna
Purchase Details
Closed on
Jan 5, 2006
Sold by
Nichols Harold J and The Provident Bank
Bought by
Deutsche Bank Trust Co and Secur Asset Backed Receivables Llc Trust
Purchase Details
Closed on
Nov 18, 2003
Sold by
Nichols Harold J and Nichols Ladonna
Bought by
Nichols Harold J
Home Financials for this Owner
Home Financials are based on the most recent Mortgage that was taken out on this home.
Original Mortgage
$79,900
Interest Rate
9.25%
Mortgage Type
Purchase Money Mortgage
Create a Home Valuation Report for This Property
The Home Valuation Report is an in-depth analysis detailing your home's value as well as a comparison with similar homes in the area
Home Values in the Area
Average Home Value in this Area
Purchase History
| Date | Buyer | Sale Price | Title Company |
|---|---|---|---|
| Dent Tironica | $114,000 | Nations Title Agency Of Miss | |
| Waddle John | $79,000 | Service Link | |
| Deutsche Bank Trust Co | -- | Chicago Title | |
| Nichols Harold J | -- | Nations Title Agency Of Miss |
Source: Public Records
Mortgage History
| Date | Status | Borrower | Loan Amount |
|---|---|---|---|
| Open | Dent Tironica | $91,200 | |
| Previous Owner | Nichols Harold J | $79,900 |
Source: Public Records
Tax History Compared to Growth
Tax History
| Year | Tax Paid | Tax Assessment Tax Assessment Total Assessment is a certain percentage of the fair market value that is determined by local assessors to be the total taxable value of land and additions on the property. | Land | Improvement |
|---|---|---|---|---|
| 2024 | $2,075 | $16,906 | $1,406 | $15,500 |
| 2023 | $1,763 | $15,280 | $1,271 | $14,009 |
| 2022 | $1,467 | $13,392 | $1,114 | $12,278 |
| 2021 | $1,437 | $12,691 | $1,056 | $11,635 |
| 2020 | $1,699 | $13,295 | $1,106 | $12,189 |
| 2019 | $1,703 | $13,295 | $1,106 | $12,189 |
| 2018 | $1,714 | $13,489 | $1,122 | $12,367 |
| 2017 | $1,650 | $13,163 | $1,095 | $12,068 |
| 2016 | $1,759 | $12,838 | $1,091 | $11,747 |
| 2014 | $1,370 | $12,698 | $1,079 | $11,619 |
| 2013 | $2,967 | $11,911 | $1,012 | $10,899 |
Source: Public Records
Map
Nearby Homes
- 1997 Oak Tree Ln
- 2013 Maple Tree Ln
- 2014 Florence St
- 2 Margie Dr
- 1713 Loretta Ave
- 2025 Sandy Ridge Rd
- 1128 Saint Benedict Dr
- 2016 Lynn St
- 2005 Louise Ave
- 1106 Saint Boniface Dr
- 2274 Carol St
- 1426 Richard Dr
- 1505 Camp Jackson Rd
- 34 Marilyn Ln
- 17 Hanover Ln
- 10 E Adams Dr
- 913 Joliet Dr Unit 1
- 30 Marilyn Ln
- 16 Helen Ct
- 22 Marilyn Ln
- 1994 Maple Tree Ln
- 1990 Maple Tree Ln
- 1907 Florence St
- 1913 Florence St
- 1903 Florence St
- 1996 Maple Tree Ln
- 1993 Maple Tree Ln
- 1991 Maple Tree Ln
- 1988 Maple Tree Ln
- 1995 Maple Tree Ln
- 1915 Florence St
- 1203 Pine Tree Ln
- 1997 Maple Tree Ln
- 2000 Maple Tree Ln
- 1919 Florence St
- 1205 Pine Tree Ln
- 1990 Oak Tree Ln
- 1992 Oak Tree Ln
- 1999 Maple Tree Ln
- 1994 Oak Tree Ln