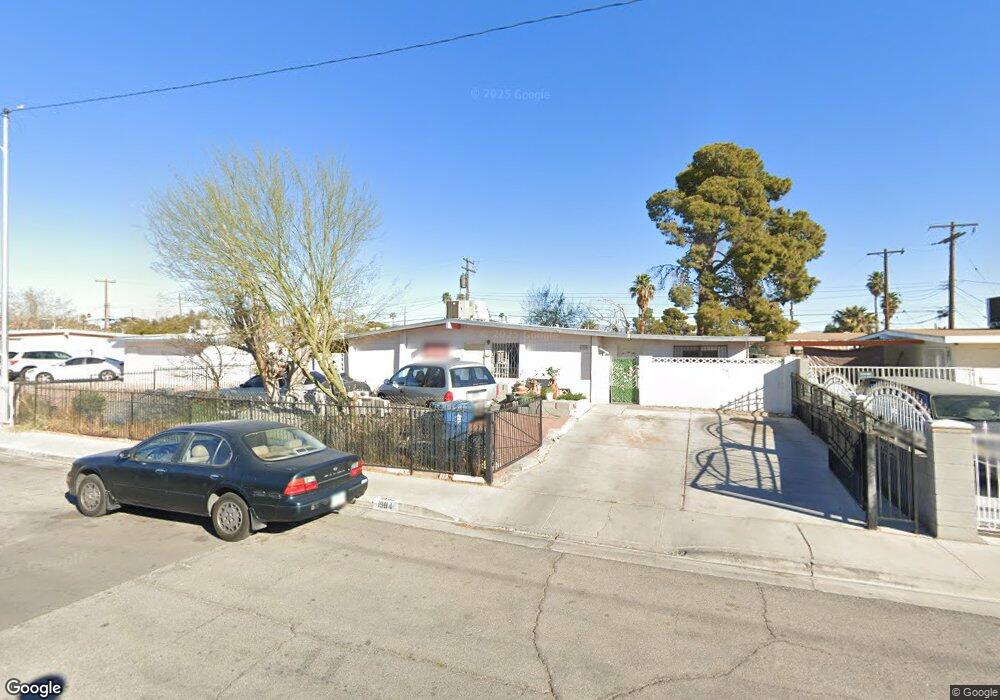
1994 Balboa Ave Las Vegas, NV 89169
Estimated Value: $253,000 - $332,000
2
Beds
1
Bath
875
Sq Ft
$334/Sq Ft
Est. Value
About This Home
This home is located at 1994 Balboa Ave, Las Vegas, NV 89169 and is currently estimated at $291,899, approximately $333 per square foot. 1994 Balboa Ave is a home located in Clark County with nearby schools including Robert E Lake Elementary School, Knudson Academy of the Arts, and Valley High School.
Ownership History
Date
Name
Owned For
Owner Type
Purchase Details
Closed on
Jan 12, 2010
Sold by
Bastawang Mercedes B
Bought by
Sol Semina B
Current Estimated Value
Purchase Details
Closed on
Dec 7, 2009
Sold by
Basti Leonard and Bastawang Mercedes B
Bought by
Bastawang Mercedes B
Purchase Details
Closed on
Nov 20, 2009
Sold by
Basti Leonard
Bought by
Basti Leonard and Bastawang Mercedes B
Purchase Details
Closed on
Sep 4, 2008
Sold by
Reible John Joseph and Reible Ruth S
Bought by
Basti Leonard
Home Financials for this Owner
Home Financials are based on the most recent Mortgage that was taken out on this home.
Original Mortgage
$93,301
Outstanding Balance
$62,266
Interest Rate
6.59%
Mortgage Type
FHA
Estimated Equity
$229,633
Purchase Details
Closed on
Jun 18, 2008
Sold by
Reible John Joseph
Bought by
Reible John Joseph and Reible Ruth S
Purchase Details
Closed on
Apr 28, 2007
Sold by
Reible John and Reible Phyllis Lillian
Bought by
Reible Ii John Joseph
Create a Home Valuation Report for This Property
The Home Valuation Report is an in-depth analysis detailing your home's value as well as a comparison with similar homes in the area
Home Values in the Area
Average Home Value in this Area
Purchase History
| Date | Buyer | Sale Price | Title Company |
|---|---|---|---|
| Sol Semina B | -- | None Available | |
| Bastawang Mercedes B | -- | None Available | |
| Basti Leonard | -- | None Available | |
| Basti Leonard | $95,000 | North American Title Main | |
| Reible John Joseph | -- | None Available | |
| Reible Ii John Joseph | -- | None Available |
Source: Public Records
Mortgage History
| Date | Status | Borrower | Loan Amount |
|---|---|---|---|
| Open | Basti Leonard | $93,301 |
Source: Public Records
Tax History Compared to Growth
Tax History
| Year | Tax Paid | Tax Assessment Tax Assessment Total Assessment is a certain percentage of the fair market value that is determined by local assessors to be the total taxable value of land and additions on the property. | Land | Improvement |
|---|---|---|---|---|
| 2025 | $552 | $40,866 | $28,000 | $12,866 |
| 2024 | $536 | $40,866 | $28,000 | $12,866 |
| 2023 | $536 | $44,806 | $33,250 | $11,556 |
| 2022 | $546 | $38,404 | $28,000 | $10,404 |
| 2021 | $505 | $33,805 | $24,150 | $9,655 |
| 2020 | $466 | $33,538 | $24,150 | $9,388 |
| 2019 | $437 | $28,636 | $19,600 | $9,036 |
| 2018 | $417 | $25,651 | $17,150 | $8,501 |
| 2017 | $699 | $23,825 | $15,400 | $8,425 |
| 2016 | $392 | $17,267 | $9,100 | $8,167 |
| 2015 | $390 | $15,199 | $9,100 | $6,099 |
| 2014 | $378 | $12,490 | $6,300 | $6,190 |
Source: Public Records
Map
Nearby Homes
- 2748 Del Mar Place
- 2749 Del Mar Place
- 2824 El Toreador St
- 2825 Burnham Ave
- 2773 Talbot St
- 2080 Karen Ave Unit 68
- 2080 Karen Ave Unit 1
- 2080 Karen Ave Unit 76
- 2080 Karen Ave Unit B49
- 2080 Karen Ave Unit 94
- 2057 Palma Vista Ave
- 2944 Burnham Ave
- 1914 Capistrano Ave
- 1628 Izabella Ave
- 3018 Burnham Ave
- 1659 Palma Vista Ave
- 1724 Palora Ave
- 1564 Vegas Valley Dr
- 2053 Palora Ave
- 2420 Old Forge Ln Unit 104
- 2010 Balboa Ave Unit 8
- 1978 Balboa Ave
- 2748 Del Mar Ct
- 1962 Balboa Ave
- 2749 Del Mar Ct
- 2757 El Toreador St
- 1995 Balboa Ave
- 2742 Del Mar Ct
- 1979 Balboa Ave
- 2011 Balboa Ave
- 1963 Balboa Ave
- 2747 El Toreador St
- 1946 Balboa Ave
- 2027 Balboa Ave
- 2743 Del Mar Ct
- 2734 Del Mar Ct
- 1947 Balboa Ave
- 1994 La Brisa Ave
- 1978 La Brisa Ave