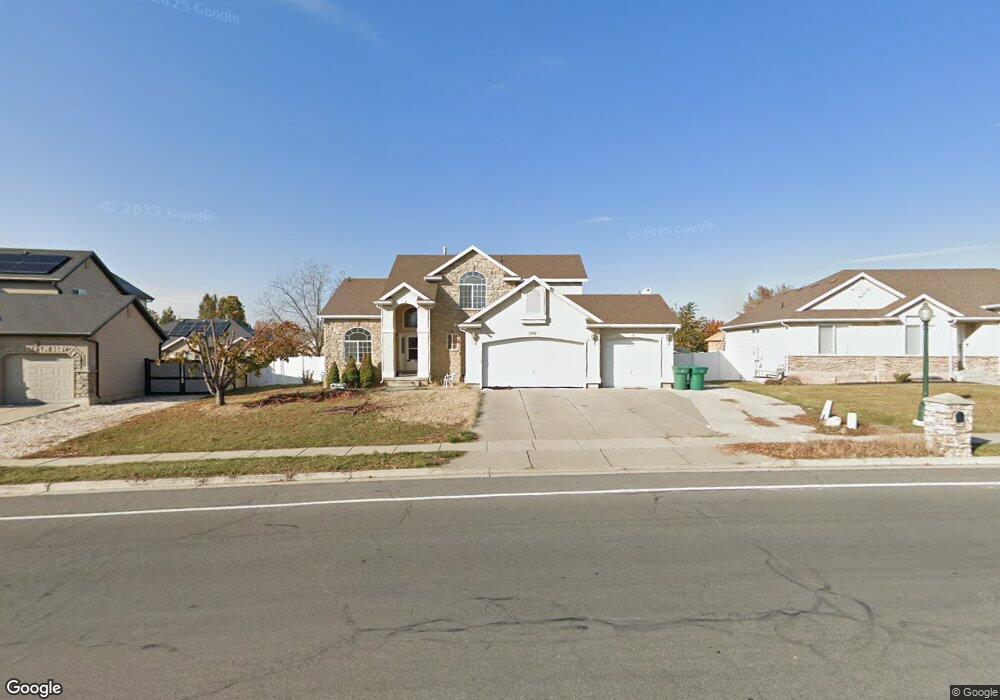
1994 Chelemes Way Clearfield, UT 84015
Estimated Value: $593,000 - $628,000
6
Beds
4
Baths
3,537
Sq Ft
$172/Sq Ft
Est. Value
About This Home
This home is located at 1994 Chelemes Way, Clearfield, UT 84015 and is currently estimated at $607,582, approximately $171 per square foot. 1994 Chelemes Way is a home located in Davis County with nearby schools including Antelope Elementary School, North Davis Junior High School, and Clearfield High School.
Ownership History
Date
Name
Owned For
Owner Type
Purchase Details
Closed on
Oct 17, 2008
Sold by
Hunt Brandon and Hunt Merinda
Bought by
Loucks Brent A and Loucks Loretta J
Current Estimated Value
Home Financials for this Owner
Home Financials are based on the most recent Mortgage that was taken out on this home.
Original Mortgage
$250,000
Outstanding Balance
$165,284
Interest Rate
6.31%
Mortgage Type
VA
Estimated Equity
$442,298
Purchase Details
Closed on
Jun 19, 2002
Sold by
Gmw Development Inc
Bought by
Delgado Tammy D
Home Financials for this Owner
Home Financials are based on the most recent Mortgage that was taken out on this home.
Original Mortgage
$180,207
Interest Rate
8.12%
Create a Home Valuation Report for This Property
The Home Valuation Report is an in-depth analysis detailing your home's value as well as a comparison with similar homes in the area
Home Values in the Area
Average Home Value in this Area
Purchase History
| Date | Buyer | Sale Price | Title Company |
|---|---|---|---|
| Loucks Brent A | -- | Hickman Land Title Co | |
| Delgado Tammy D | -- | Bonneville Title Company Inc |
Source: Public Records
Mortgage History
| Date | Status | Borrower | Loan Amount |
|---|---|---|---|
| Open | Loucks Brent A | $250,000 | |
| Previous Owner | Delgado Tammy D | $180,207 |
Source: Public Records
Tax History Compared to Growth
Tax History
| Year | Tax Paid | Tax Assessment Tax Assessment Total Assessment is a certain percentage of the fair market value that is determined by local assessors to be the total taxable value of land and additions on the property. | Land | Improvement |
|---|---|---|---|---|
| 2025 | $3,603 | $322,850 | $78,103 | $244,747 |
| 2024 | $3,479 | $314,049 | $74,625 | $239,424 |
| 2023 | $3,314 | $301,950 | $65,354 | $236,595 |
| 2022 | $3,554 | $579,000 | $122,695 | $456,305 |
| 2021 | $3,302 | $447,000 | $74,791 | $372,209 |
| 2020 | $2,871 | $386,000 | $63,477 | $322,523 |
| 2019 | $2,757 | $366,000 | $64,414 | $301,586 |
| 2018 | $2,629 | $340,000 | $57,174 | $282,826 |
| 2016 | $2,355 | $159,225 | $23,041 | $136,184 |
| 2015 | $2,331 | $150,260 | $23,041 | $127,219 |
| 2014 | $2,317 | $151,336 | $23,041 | $128,295 |
| 2013 | $2,002 | $125,060 | $37,125 | $87,935 |
Source: Public Records
Map
Nearby Homes
- 2002 Chelemes Way
- 1974 Chelemes Way
- 1993 S 350 E
- 1979 S 350 E
- 2003 S 350 E
- 2012 Chelemes Way
- 1958 Chelemes Way
- 1953 S 350 E
- 2013 S 350 E
- 2011 Chelemes Way
- 1963 S 350 E
- 1971 Chelemes Way
- 1940 Chelemes Way
- 2022 Chelemes Way
- 2023 S 350 E
- 1996 S 350 E
- 1947 S 350 E
- 1982 S 350 E
- 2004 S 350 E
- 2004 S 350 E Unit 34