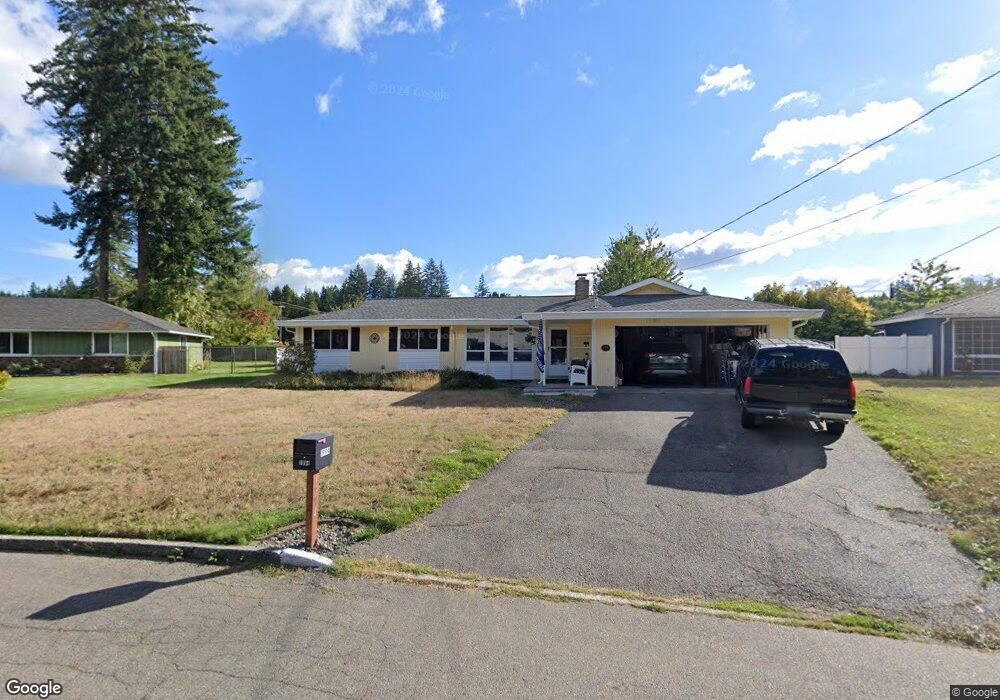
1994 SE Juniper Ct Port Orchard, WA 98366
Parkwood NeighborhoodEstimated Value: $392,000 - $448,000
3
Beds
1
Bath
1,228
Sq Ft
$347/Sq Ft
Est. Value
About This Home
This home is located at 1994 SE Juniper Ct, Port Orchard, WA 98366 and is currently estimated at $426,399, approximately $347 per square foot. 1994 SE Juniper Ct is a home located in Kitsap County with nearby schools including Orchard Heights Elementary School, Marcus Whitman Middle School, and South Kitsap High School.
Ownership History
Date
Name
Owned For
Owner Type
Purchase Details
Closed on
Jun 28, 2001
Sold by
Deatherage Ronnie L and Deatherage Diana M
Bought by
Wilkerson James A and Wilkerson Carol J
Current Estimated Value
Home Financials for this Owner
Home Financials are based on the most recent Mortgage that was taken out on this home.
Original Mortgage
$80,000
Outstanding Balance
$30,830
Interest Rate
7.14%
Mortgage Type
Seller Take Back
Estimated Equity
$395,569
Create a Home Valuation Report for This Property
The Home Valuation Report is an in-depth analysis detailing your home's value as well as a comparison with similar homes in the area
Home Values in the Area
Average Home Value in this Area
Purchase History
| Date | Buyer | Sale Price | Title Company |
|---|---|---|---|
| Wilkerson James A | $90,955 | First American Title Ins Co |
Source: Public Records
Mortgage History
| Date | Status | Borrower | Loan Amount |
|---|---|---|---|
| Open | Wilkerson James A | $80,000 |
Source: Public Records
Tax History Compared to Growth
Tax History
| Year | Tax Paid | Tax Assessment Tax Assessment Total Assessment is a certain percentage of the fair market value that is determined by local assessors to be the total taxable value of land and additions on the property. | Land | Improvement |
|---|---|---|---|---|
| 2026 | $1,710 | $387,510 | $74,130 | $313,380 |
| 2025 | $1,710 | $359,150 | $62,970 | $296,180 |
| 2024 | $3,090 | $359,150 | $62,970 | $296,180 |
| 2023 | $3,069 | $359,150 | $62,970 | $296,180 |
| 2022 | $3,018 | $296,030 | $58,810 | $237,220 |
| 2021 | $2,772 | $256,900 | $54,640 | $202,260 |
| 2020 | $2,724 | $245,340 | $52,040 | $193,300 |
| 2019 | $2,280 | $224,580 | $51,100 | $173,480 |
| 2018 | $2,393 | $183,700 | $51,100 | $132,600 |
| 2017 | $2,055 | $183,700 | $51,100 | $132,600 |
| 2016 | $2,010 | $164,460 | $51,100 | $113,360 |
| 2015 | $1,947 | $161,480 | $51,100 | $110,380 |
| 2014 | -- | $158,500 | $51,100 | $107,400 |
| 2013 | -- | $156,480 | $53,790 | $102,690 |
Source: Public Records
Map
Nearby Homes
- 3589 SE Pine Tree Dr
- 1703 Harrison Ave SE
- 1663 Harrison Ave SE
- 0 Wendell Ave SE
- 3900 SE Mile Hill Dr
- 3930 SE Mile Hill Dr
- 4990 Mile Hill Dr
- 190 SE Mile Hill Dr
- 4010 SE Lovell St
- 2949 SE Mile Hill Dr Unit C-2
- 3696 SE Greenbriar Place
- 3300 Madrona Dr SE
- 3817 SE Horstman Rd
- 4305 SE Elijah Ct
- 4 SE Sinclair View Dr
- 0 Lincoln Ave SE
- 4233 SE Horsehead Way
- 4592 SE Basswood Ln
- 2723 Lincoln Ave SE
- 2169 Ponderosa Dr SE
- 1990 SE Juniper Ct
- 1998 SE Juniper Ct
- 3423 SE Tamarack Dr
- 3397 SE Tamarack Dr
- 3447 SE Tamarack Dr
- 1993 SE Juniper Ct
- 3375 SE Tamarack Dr
- 1986 SE Juniper Ct
- 2002 SE Juniper Ct
- 2003 SE Juniper Ct
- 2074 Madrona Dr SE
- 3473 SE Tamarack Dr
- 3353 SE Tamarack Dr
- 2052 Madrona Dr SE
- 1981 SE Juniper Ct
- 1982 SE Juniper Ct
- 2006 SE Juniper Ct
- 3410 SE Tamarack Dr
- 3432 SE Tamarack Dr
- 1948 SE Sequoia St