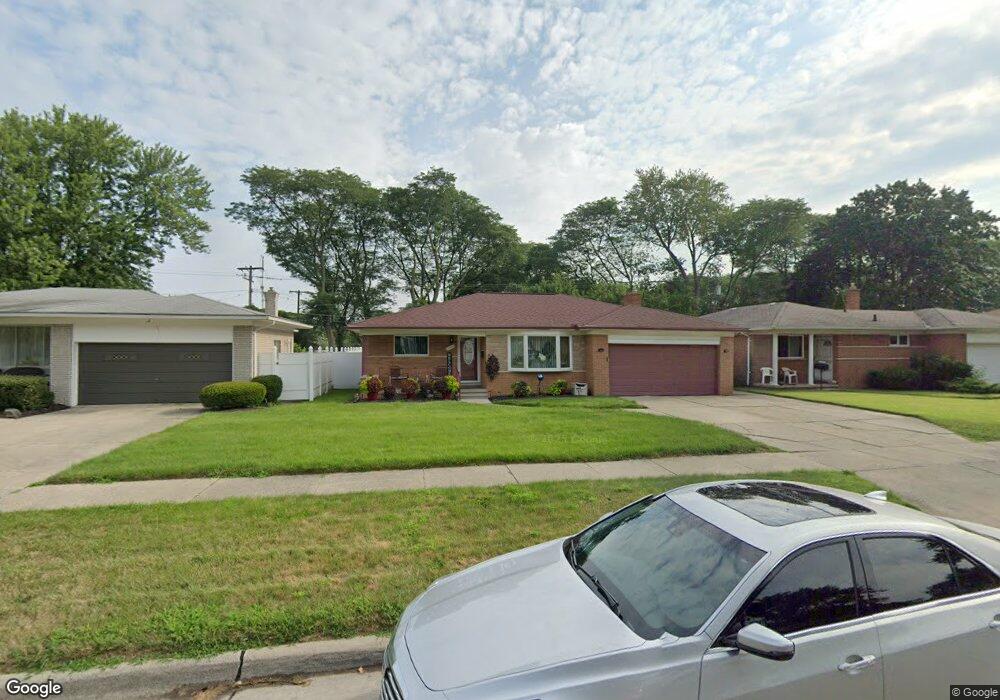
19943 Fleetwood Dr Harper Woods, MI 48225
Estimated Value: $255,000 - $290,000
--
Bed
1
Bath
2,204
Sq Ft
$125/Sq Ft
Est. Value
About This Home
This home is located at 19943 Fleetwood Dr, Harper Woods, MI 48225 and is currently estimated at $275,221, approximately $124 per square foot. 19943 Fleetwood Dr is a home located in Wayne County with nearby schools including Parcells Middle School, Grosse Pointe North High School, and Distinctive College Prep: Harper Woods.
Ownership History
Date
Name
Owned For
Owner Type
Purchase Details
Closed on
Mar 19, 2007
Sold by
Bryant Rosa and Burton Bobbie J
Bought by
Mcclain Latonya
Current Estimated Value
Home Financials for this Owner
Home Financials are based on the most recent Mortgage that was taken out on this home.
Original Mortgage
$203,000
Outstanding Balance
$123,209
Interest Rate
6.31%
Mortgage Type
Purchase Money Mortgage
Estimated Equity
$152,012
Purchase Details
Closed on
Oct 2, 2003
Sold by
Bryant Rosa and Bryant Rosa Lee
Bought by
Bryant Rosa
Purchase Details
Closed on
Jun 9, 2003
Sold by
Thompson Sylvia
Bought by
Bryant Rosa
Purchase Details
Closed on
May 14, 2003
Sold by
Horn Delano
Bought by
Indymac Bank Fsb
Purchase Details
Closed on
Feb 27, 2001
Sold by
Horn Delano
Bought by
Thompson Sylvia
Purchase Details
Closed on
Mar 6, 1998
Sold by
Donna Eleanor E Lorenz
Bought by
Kniaz Thomas
Create a Home Valuation Report for This Property
The Home Valuation Report is an in-depth analysis detailing your home's value as well as a comparison with similar homes in the area
Home Values in the Area
Average Home Value in this Area
Purchase History
| Date | Buyer | Sale Price | Title Company |
|---|---|---|---|
| Mcclain Latonya | $203,000 | National Title & Escrow | |
| Bryant Rosa | -- | Summit Title | |
| Bryant Rosa | $183,000 | Great Lakes Title Michigan | |
| Indymac Bank Fsb | $162,900 | -- | |
| Thompson Sylvia | -- | -- | |
| Kniaz Thomas | $166,785 | -- |
Source: Public Records
Mortgage History
| Date | Status | Borrower | Loan Amount |
|---|---|---|---|
| Open | Mcclain Latonya | $203,000 |
Source: Public Records
Tax History Compared to Growth
Tax History
| Year | Tax Paid | Tax Assessment Tax Assessment Total Assessment is a certain percentage of the fair market value that is determined by local assessors to be the total taxable value of land and additions on the property. | Land | Improvement |
|---|---|---|---|---|
| 2025 | $1,539 | $126,700 | $0 | $0 |
| 2024 | $1,539 | $117,900 | $0 | $0 |
| 2023 | $1,468 | $103,200 | $0 | $0 |
| 2022 | $4,806 | $100,700 | $0 | $0 |
| 2021 | $4,418 | $97,000 | $0 | $0 |
| 2019 | $4,459 | $69,600 | $0 | $0 |
| 2018 | $1,093 | $59,400 | $0 | $0 |
| 2017 | $5,995 | $58,400 | $0 | $0 |
| 2016 | $2,504 | $37,200 | $0 | $0 |
| 2015 | $4,250 | $53,800 | $0 | $0 |
| 2013 | $4,070 | $40,700 | $0 | $0 |
| 2012 | $582 | $41,500 | $9,700 | $31,800 |
Source: Public Records
Map
Nearby Homes
- 20537 Williamsburg Ct
- 20260 Lancaster St
- 19637 Country Club Dr
- 20251 Country Club Dr
- 19685 Lochmoor St
- 20428 Lennon St
- 20006 Lochmoor St
- 20456 Lennon St
- 20490 van Antwerp St Unit 24
- 20488 Fleetwood Dr
- 19711 Damman St
- 20202 Hunt Club Dr
- 20521 Lancaster St
- Manchester Plan at Fraser Sqaure
- Davenport Plan at Fraser Sqaure
- 20490 Country Club Dr
- 20498 Country Club Dr
- 19926 Damman St
- 20520 Anita St
- 20616 Lancaster St
- 19931 Fleetwood Dr
- 19955 Fleetwood Dr
- 20441 Williamsburg Ct Unit 53
- 19919 Fleetwood Dr
- 19967 Fleetwood Dr
- 20425 Williamsburg Ct Unit 55
- 20429 Williamsburg Ct Unit 54
- 20445 Williamsburg Ct
- 19907 Fleetwood Dr
- 20421 Williamsburg Ct
- 20421 Williamsburg Ct
- 20449 Williamsburg Ct Unit 51
- 20420 Williamsburg Ct
- 20461 Williamsburg Ct
- 19954 Fleetwood Dr
- 19942 Fleetwood Dr
- 19979 Fleetwood Dr
- 19966 Fleetwood Dr
- 19928 Fleetwood Dr
- 20465 Williamsburg Ct Unit 49